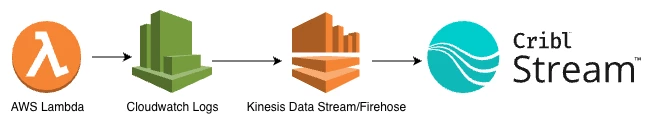
AWS Lambda is a great fit for event-driven workloads, but getting observability data out of Lambda and into the rest of your tooling is often… less great. The “traditional” pattern below works, but it’s slow to iterate on, hard to debug, and expensive to maintain.
This article walks through a simpler, more direct path:
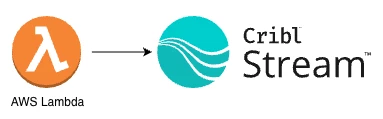
No Kinesis. No custom log shippers. Just the Lambda Telemetry API, the OpenTelemetry Collector as a Lambda extension, and Cribl Stream. While Cribl Edge is not available on Lambda, this approach delivers a similar near-source collection pattern for serverless workloads.
You’ll get:
- Lambda function logs (your console.log and friends) in Stream
- Platform lifecycle events (START, END, REPORT equivalents) in Stream
- Application traces and metrics from your Lambda runtime into Stream
- A configuration that is language-agnostic on the collector side and easy to extend
When to Use This Pattern
This direct-to-Stream pattern is a great fit when you want low-latency Lambda telemetry and fewer moving parts, and you’re comfortable with the buffering and retry behavior inside the Lambda execution and the collector extension.
If you need stronger durability guarantee - for example, guarantee capture of all logs even if Cribl is temporarily unavailable or the network is having issues - you can still use a Firehose → S3/SQS → Cribl Stream pattern for Lambda telemetry. In that model, S3 provides persistent storage and SQS notifications let Cribl Stream consume data asynchronously once it’s available, which reduces the risk of dropped data at very high scale or during outages. You can read more on this here:
https://cribl.io/blog/replacing-kinesis-data-streams-with-cribl-stream-a-real-world-cost-saving/
What We’re Building
At a high level, the data flow looks like this:
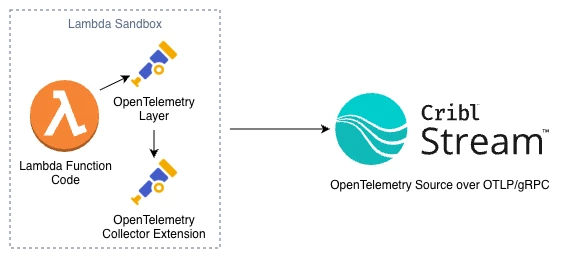
Conceptually, there are three components:
- Lambda function
Your Node.js (or other) handler that logs, handles events, and optionally emits traces/metrics via OpenTelemetry SDK auto-instrumentation. - OpenTelemetry Lambda layers
- A runtime-specific layer (e.g., Node.js) that auto-instruments your function and sends telemetry locally.
- A Collector extension layer that runs an OpenTelemetry Collector inside the Lambda execution environment.
- Cribl Stream OpenTelemetry Source
A source on your Cribl worker(s) that listens for OTLP (traces, logs, metrics) and turns those into events you can route, enrich, and ship anywhere.
We’ll use two receivers in the collector:
- otlp - for SDK-native telemetry from the runtime layer (traces, metrics)
- telemetryapi - for Lambda Telemetry API events (function logs and platform events)
Then we’ll export everything to Cribl Stream via OTLP/gRPC.
Why This Over CloudWatch → Kinesis → Cribl?
You can absolutely keep shipping from CloudWatch Logs into Cribl via Kinesis, Firehose, or another forwarder. But the Lambda + OTel extension approach gives you:
- Ultra-low latency and simplicity with the One hop architecture
- Unified telemetry - traces, logs, and metrics over one protocol (OTLP)
- Less operational drag - no Kinesis scaling, shard math, or retention tuning
- Better control over buffering, retry, and routing via the OpenTelemetry Collector
You also get a cleaner story to tell internally:
“Our Lambdas send all their telemetry directly to Cribl over OTLP, using the Lambda Telemetry API and the OpenTelemetry Collector extension as the bridge.”
Prerequisites
You’ll need:
- A Cribl Stream deployment (self-managed or Cribl.Cloud)
- A Worker Group with an OpenTelemetry Source configured
- An AWS Lambda function (we’ll show Node.js 20.x examples, but the pattern is generic)
- IAM permissions to:
- Update Lambda configuration
- Attach Lambda layers
- Basic familiarity with:
- Editing YAML (collector.yaml)
- Setting Lambda environment variables
Step 1 - Configure the Cribl Stream OpenTelemetry Source
In Cribl Stream (or in your Cribl.Cloud workspace):
- Create or open an OpenTelemetry Source on the worker group your data should land on.
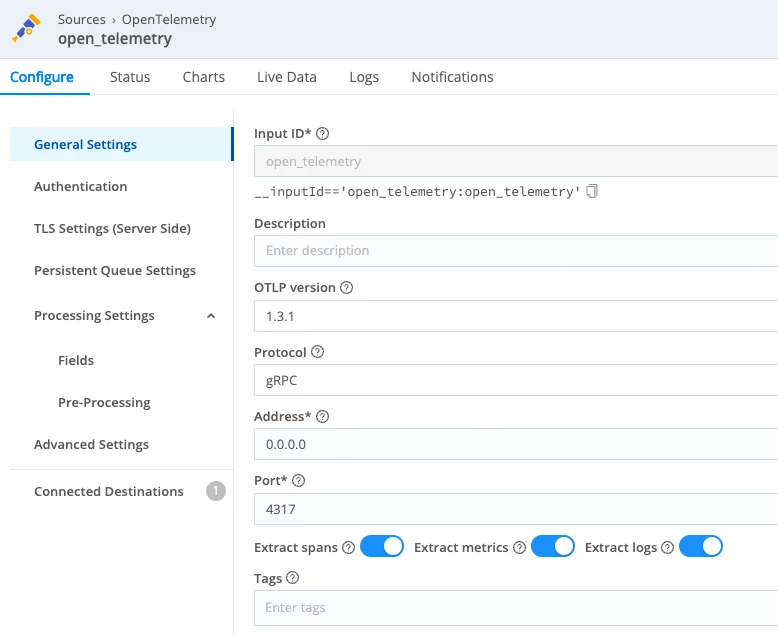
- Configure it roughly like this:
- Protocol: gRPC
- Port: 4317 (the standard OTLP/gRPC port)
- TLS: Enabled (recommended for anything outside a trusted private network)
- OTLP version: 1.3.1
- Extract traces: On
- Extract logs: On (so OTLP log records become individual events)
- Extract metrics: On, if you’ll be sending metrics
- If you’re in Cribl.Cloud:
- Use the documented ingest hostname for your Worker Group / Source.
- Keep the default OTLP port (usually 4317) unless you’ve changed it.
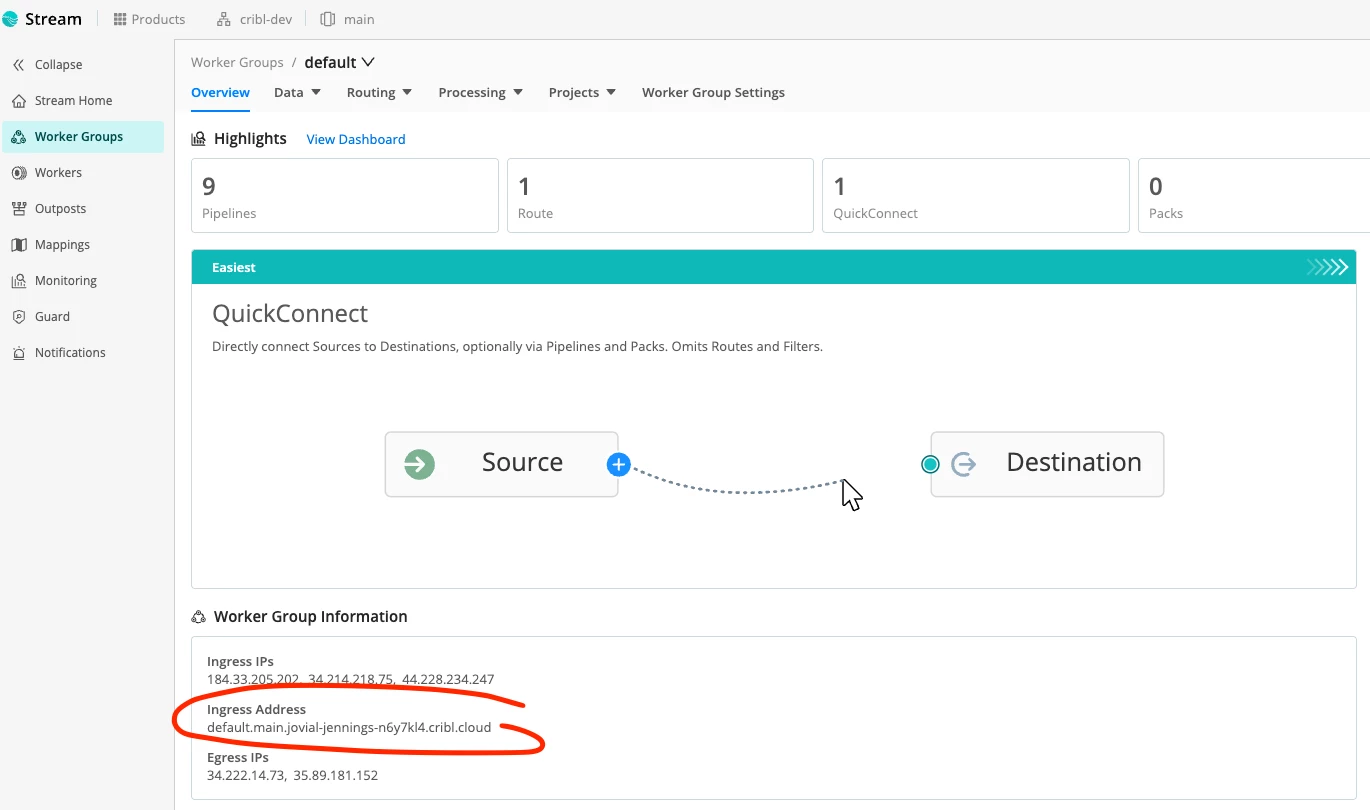
You’ll need the OTLP endpoint for the collector exporter, e.g.:
default.main.<your-workspace>.cribl.cloud:4317
or, for self-managed, something like:
otel.example.internal:4317
You can find this under “Worker Group Information” within your worker group main page:
Step 2 - Attach the OpenTelemetry Lambda Layers
We’ll use two layers:
- The OpenTelemetry Collector extension layer - runs the collector in the Lambda sandbox.
- The OpenTelemetry Node.js runtime layer - auto-instruments Node.js and sends telemetry to the local collector.
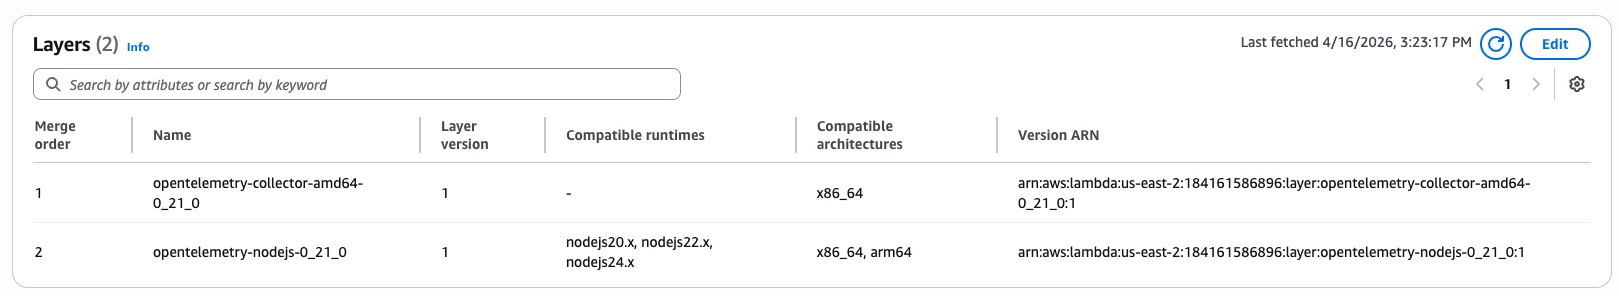
From the OpenTelemetry Lambda project, find the latest layer ARNs for your:
- Region (e.g., us-east-2)
- Architecture (x86_64 AKA amd64, or arm64)
- Runtime (nodejs24.x in this example)
They’ll look like:
arn:aws:lambda:<region>:184161586896:layer:opentelemetry-collector-<amd64|arm64>-<version>:1
arn:aws:lambda:<region>:184161586896:layer:opentelemetry-nodejs-<version>:1
Attach both layers to your Lambda function via the console or CLI. If you need a refresher on how AWS layers work, see the Lambda layers documentation and how to add layers to a function.
Step 3 - Add collector.yaml to the Lambda Package
In the root of your Lambda deployment package, add a file named collector.yaml.
Here’s a configuration that:
- Receives:
- App telemetry (traces/metrics) via otlp on localhost
- Lambda logs & platform events via telemetryapi
- Batches and decouples export
- Forwards traces and logs and optionally metrics to Cribl Stream over OTLP/gRPC
receivers:
  telemetryapi:

  otlp:
    protocols:
      grpc:
        endpoint: localhost:4317
      http:
        endpoint: localhost:4318

processors:
  batch:
  decouple:

exporters:
  otlp_grpc/cribl:
    endpoint: default.main.<your-workspace>.cribl.cloud:4317

service:
  pipelines:
    traces:
      receivers: [otlp, telemetryapi]
      processors: [batch, decouple]
      exporters: [otlp_grpc/cribl]
    logs:
      receivers: [telemetryapi]
      processors: [batch, decouple]
      exporters: [otlp_grpc/cribl]
A few key points:
- otlp receiver
Listens on localhost:4317 (gRPC) and localhost:4318 (HTTP) so the runtime layer can send OTLP. - telemetryapi receiver
Subscribes to the Lambda Telemetry API, giving you:- Function logs (your console.log output)
- Platform events (init start/done, runtime done, reports, extension state changes)
- batch + decouple processors
- batch groups telemetry before export for efficiency.
- decouple lets the collector forward data asynchronously, so export doesn’t block your function’s response path.
- otlp_grpc/cribl exporter
Sends everything to Cribl Stream’s OTLP/gRPC endpoint.
Step 4 - Configure Lambda Environment Variables
Add the following environment variables to your Lambda function:
AWS_LAMBDA_EXEC_WRAPPER=/opt/otel-handler
OPENTELEMETRY_COLLECTOR_CONFIG_URI=/var/task/collector.yaml
OPENTELEMETRY_EXTENSION_LOG_LEVEL=info
OTEL_SERVICE_NAME=OTELFunction
OTEL_RESOURCE_ATTRIBUTES=deployment.environment=dev
If you want to specify a service version:
OTEL_RESOURCE_ATTRIBUTES=deployment.environment=prod,service.version=2026.04.16
What these do:
- AWS_LAMBDA_EXEC_WRAPPER
Tells the runtime to bootstrap via the OpenTelemetry Node.js wrapper so traces/metrics are auto-instrumented. For more on the runtime behavior, see Lambda auto-instrumentation. - OPENTELEMETRY_COLLECTOR_CONFIG_URI
Points the extension at your collector.yaml. - OPENTELEMETRY_EXTENSION_LOG_LEVEL
Controls the collector extension’s own logs. Use debug while you’re building, then dial it down (info/warn) later.
Step 5 - Add a Simple Handler and Test Log
Here’s a minimal Node.js handler you can use to test:
export const handler = async (event) => {
  console.log('test log');
  const response = {
    statusCode: 200,
    body: JSON.stringify('Hello from Lambda')
  };
  return response;
};
Deploy the updated bundle (code + collector.yaml).
Step 6 - Validate in Cribl Stream (validate)
In Cribl Stream:
- Open the OpenTelemetry Source you configured earlier.
- Click Live (Live Data) on the Worker Group.
- Invoke the Lambda and watch events arrive.
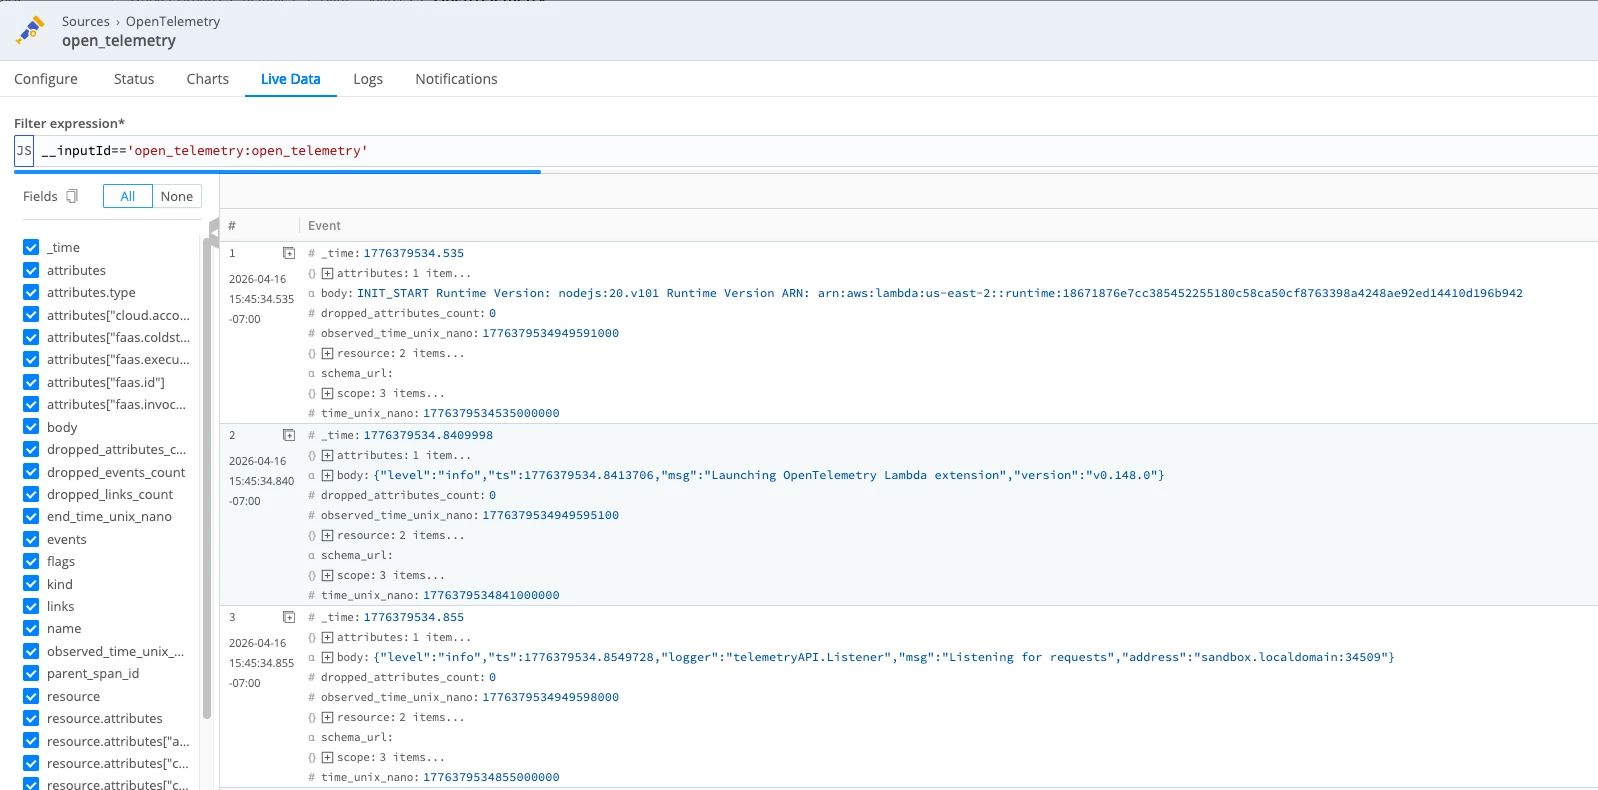
In Live Data, you should see Lambda telemetry arriving as OpenTelemetry events. Depending on which fields you’ve selected and whether the event objects are expanded, you may see:
- log records with body values such as INIT_START, extension logs, and function logs
- attributes.type values such as function, platform.initStart, platform.runtimeDone, or platform.start
- trace records as separate events with fields like trace_id, span_id, name, and kind
If those fields are not visible inline, expand the event or add fields like __otlp.type, attributes.type, trace_id, and span_id to the view.
Understanding the “Delayed” END/REPORT Behavior
You may notice something interesting:
- The START and your test log for a given RequestId show up quickly.
- END / REPORT-equivalent events (for example, platform.runtimeDone) can appear slightly later — sometimes during the next invocation or at shutdown.
This is expected.
Lambda can freeze the execution environment between invocations. The OTel collector extension, with batch and decouple, is allowed to:
- Buffer telemetry
- Flush data:
- at the tail end of the invocation
- during the next invocation
- or during final shutdown
In practice, that means:
- You might see END RequestId: A in Stream right before or during START RequestId: B.
- The function log line and trace span for a given faas.execution still align correctly.
- The slight time skew is a trade-off for:
- lower overhead during the critical path
- more robust delivery under transient network conditions
This is a good talking point when you explain the architecture internally:
“Lambda telemetry isn’t continuous — it’s invocation-coupled. The extension flushes telemetry in bursts around invocations and shutdowns.”
If you want more background on the event model itself, AWS documents the Telemetry API and event types in the Telemetry API guide and event schema reference.
Optional: Enabling Metrics
If you want metrics from your Lambda as well, you already have most of the pieces. Add the following:
- Keep the metrics pipeline in collector.yaml:
metrics:
  receivers: [otlp]
  processors: [batch, decouple]
exporters: [otlp_grpc/cribl]- Configure Node.js metrics export to target the local collector. For example:
OTEL_METRICS_EXPORTER=otlp
OTEL_EXPORTER_OTLP_ENDPOINT=http://localhost:4318- In Cribl, route __otlp.type="metrics" events into whatever downstream store or dashboarding system you use, such as Cribl Lake.
NOTE: If you see 404 OTLPExporterError: Not Found from the Node metrics exporter, that usually means the metrics endpoint path is wrong for OTLP/HTTP. Using the base http://localhost:4318 and letting the SDK append /v1/metrics for you is the safest default. The Node.js Lambda runtime behavior is documented in Lambda auto-instrumentation.
What to Expect
Once everything is wired up:
- From Lambda’s perspective:
- You didn’t add any custom client logic to talk to Cribl.
- You added two layers, a config file, and some env vars.
- You still see CloudWatch logs for safety and debugging.
- From Cribl Stream’s perspective:
- It now receives:
- Lambda function logs
- Platform lifecycle events
- Application traces
- Optional metrics
- All via a single OpenTelemetry Source over OTLP/gRPC.
- It now receives:
- From your observability architecture perspective:
- No more dedicated CW → Kinesis → Cribl paths just for Lambda.
- A consistent OTLP-based ingestion pattern that lines up with what you’re doing for services running in containers, VMs, or Kubernetes.
- A configuration that is easy to tune, extend, and route using Cribl’s pipelines.
Where to Go Next
At this point, you’ve created the ingest path into Cribl Stream by standing up an OpenTelemetry Source and sending Lambda telemetry directly into it. The next step is to decide what Stream should do with that data.
Start by connecting the Source to a Destination using either QuickConnect for a faster guided setup or Pipelines if you want more control over routing and processing.
Once routing is in place, you can refine the data inside Stream by enriching useful fields, reducing noise, and shaping telemetry so it is easier to work with downstream. From there, you can route logs, traces, and metrics independently to the tools that make the most sense for each signal.
That is the real advantage of this pattern - the Source gets Lambda telemetry into Stream, and Stream gives you a central place to control where that data goes next and how it should be handled.