
Introduction
One of the main advantages of the Cribl platform is its ability to route data to multiple destinations effortlessly; adding a new system can be as straightforward as specifying a Destination, processing Pipeline, and Route within Cribl Stream. The Elastic Stack emerges as a particularly promising backend for integration into this setup. Built on Elasticsearch, it acts as a comprehensive search engine capable of locating specific security events—such as finding a needle in a haystack—with sub-second latency, regardless of dataset size.
The traditional method of incorporating a new vendor such as Elastic into an existing environment often requires deploying additional agents and data collectors. This can introduce complexity and potential disruptions that can be both resource-intensive and impact existing operations and system stability. We are going to describe the easiest way to send your Cribl Stream or Edge data to Elastic: Elastic’s own Cribl integration.
Elasticsearch Data Ingest 101
Before jumping into describing how Cribl Stream and Elasticsearch can work together, let’s quickly recap how Elastic integrations work. If you are familiar with the Elastic stack, feel free to skip to the next section.
How the Elastic Integrations Work
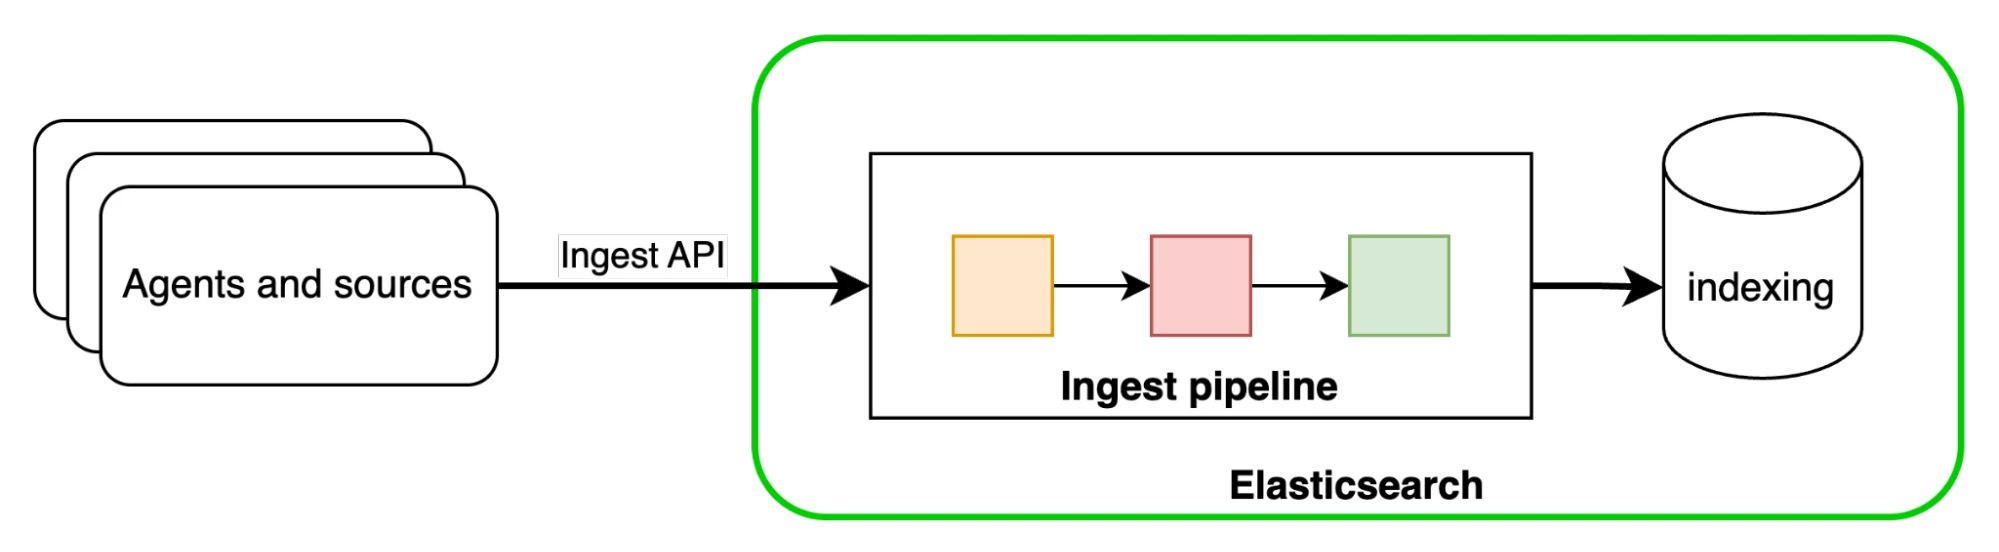
Elastic Integrations are built to simplify data collection and ingestion into Elasticsearch by providing pre-configured setups of different Elastic stack components. Various operational data types from hosts, applications, containers, and more are gathered by lightweight log shippers such as Elastic Agents and APM agents. All data types are sent to Elasticsearch, where they are organized into data streams: append-only, high-velocity time-series indices optimized for rapid ingestion. To maintain consistency across sources, data is mapped to the Elastic Common Schema (ECS), offering a standardized format that makes analysis and correlation easier.
Once in Elasticsearch, data passes through ingest pipelines, which are predefined sequences of processors that transform or enrich incoming documents before indexing. These pipelines handle tasks like parsing JSON fields, appending metadata, converting date formats, and more. Each integration sends data to its own data stream, which has an assigned default ingest pipeline. This pipeline processes all data parsing, converting data into ECS before it is indexed and stored in Elasticsearch.
To use Elastic integrations, data will be sent from Cribl Edge or Stream to Elasticsearch, and the integrations activated through their predefined ingest pipelines. These pipelines convert the data from Cribl into the Elastic Common Schema and ensure it enters the correct data streams. As a result, all the prebuilt features in Elasticsearch and Kibana, such as dashboards, UIs, alerts, and ML jobs, will function seamlessly.
Elastic Cribl Integration
The Elastic Cribl integration lets you ingest logs from Cribl Stream or Edge into Elastic, enabling prebuilt integrations, dashboards and alerts.
What is the Elastic Cribl Integration?
The Elastic Cribl integration is a connector that allows users to ingest logs and metrics from Cribl into Elastic using Elastic’s Fleet integration data streams. This enables organizations to leverage the Elastic Common Schema (ECS) for unified data analysis, dashboards, and alerting.
What Does It Provide?
The Elastic Cribl integration enables ingestion of logs and metrics from Cribl into Elastic, allowing users to leverage ready-to-use dashboards and alerting features within Kibana. By mapping data to the Elastic Common Schema (ECS), the integration ensures consistency and simplifies analysis across datasets. This integration does not require the deployment of an Elastic Agent; data can be ingested directly, provided a policy with the necessary integration is configured. The integration is available in the Elastic Integrations catalogue within Kibana.
The Cribl integration, officially supported by Elastic, is available to users with a Basic subscription tier. This ensures accessible support and functionality without requiring a premium plan.
How Does Elastic Cribl Integration Work Under the Hood?
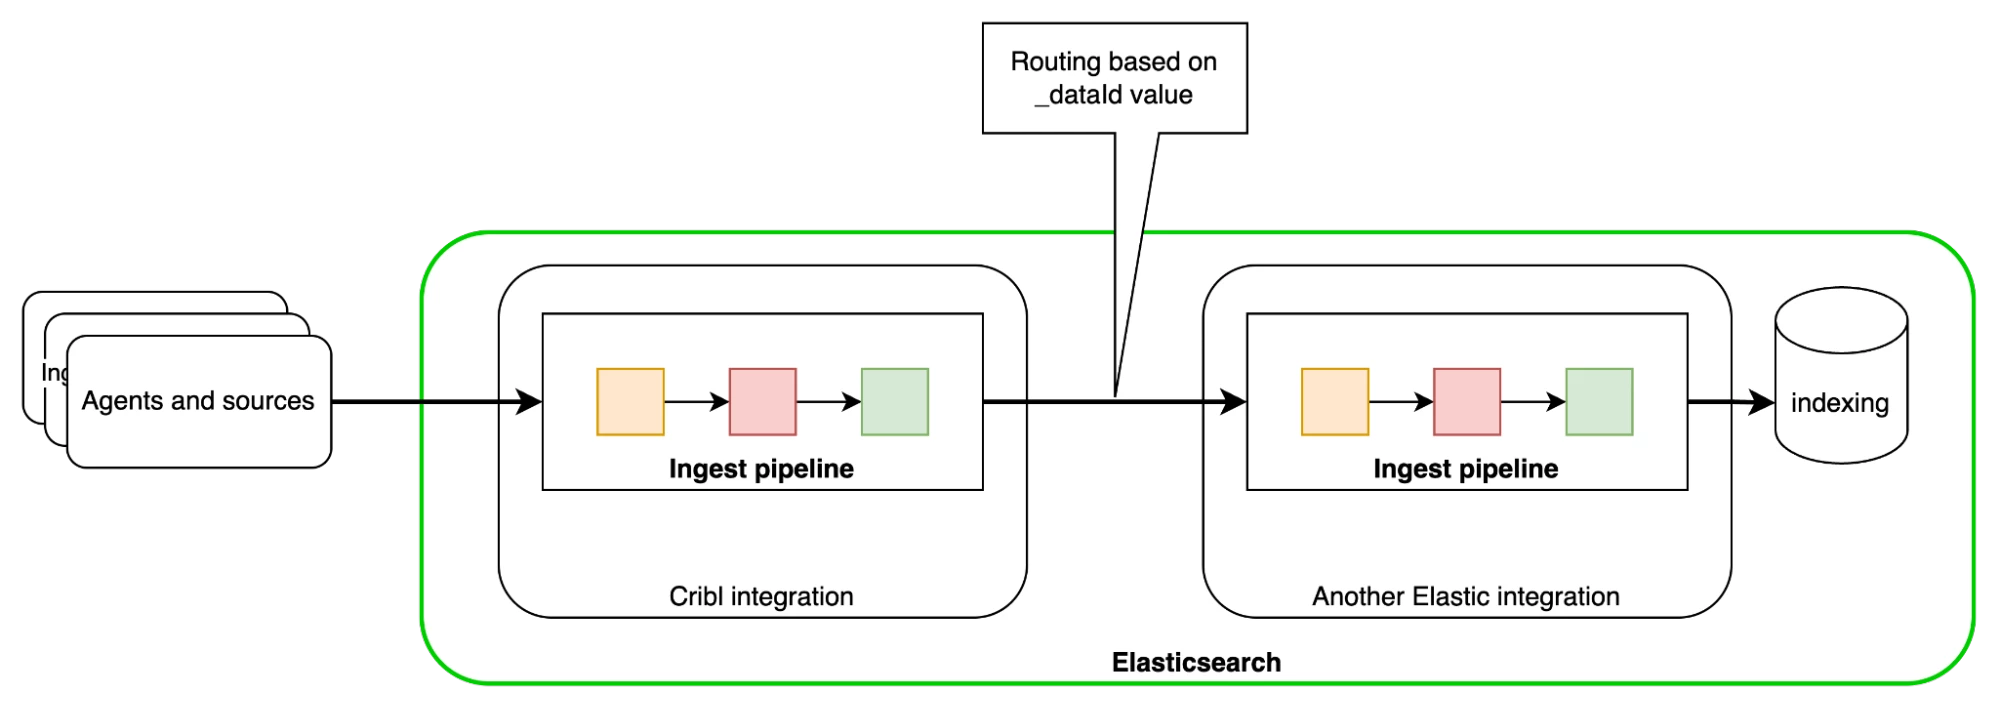
The Elastic Cribl integration works by having Cribl send logs and metrics to Elastic through either the Elastic Cloud or Elasticsearch output. The integration uses the _dataId field to route incoming data to the configured data stream within Elastic, while also tagging each event so that the Cribl integration dashboard can display both the type and volume of data ingested. Once received, the data flows into pre-configured Fleet integration data streams, where it is indexed using ECS mappings, ingest pipelines, and dashboards. Access and permissions for data ingestion are managed using API keys, ensuring secure and controlled data flow throughout the integration.
This setup allows organizations to centralize observability and security data from Cribl into Elastic for advanced analytics and monitoring.
Installation and Use
- Install Integration Assets in Kibana:
- Go to Management > Integrations in Kibana.
- Search for the Cribl integration and install it to load index templates, ingest pipelines, and dashboards. There is no need to add it to a new or an existing agent; this integration works in Elasticsearch alone.
- Configure Cribl Source:
- In Cribl Stream or Edge, set the _dataId field to specify the data source.
- See Cribl’s Data Onboarding documentation for more details.
- Map Data IDs in Kibana:
- Map each _dataId from Cribl to the corresponding Fleet integration data stream in Kibana.
- Set Up Elastic Destination in Cribl:
- Choose between Elastic Cloud output (for cloud) or Elasticsearch output (for self-managed).
- Set the Cloud ID (for cloud) or Bulk API URLs (for self-managed) to point to your Elastic cluster.
- Set the Index or Data Stream to logs-cribl-default (logs) or metrics-cribl-default (metrics).
- Provide an Elasticsearch API key with at least "auto_configure" and "write" permissions for the relevant indices.
Example: Onboarding Palo Alto NextGen Firewall Syslog Data to Elastic
I am going to use my Docker-Compose setup with Cribl Stream and Elastic stack, but you can use whatever setup you want. My GitHub repo is available here.
Let’s start up the stack. Once it is up and running, Kibana will be available on https://localhost:5601 (elastic/cribldemo) and CriblStream Admin UI at http://localhost:9000 (admin/cribldemo).
Configure the Elastic Side
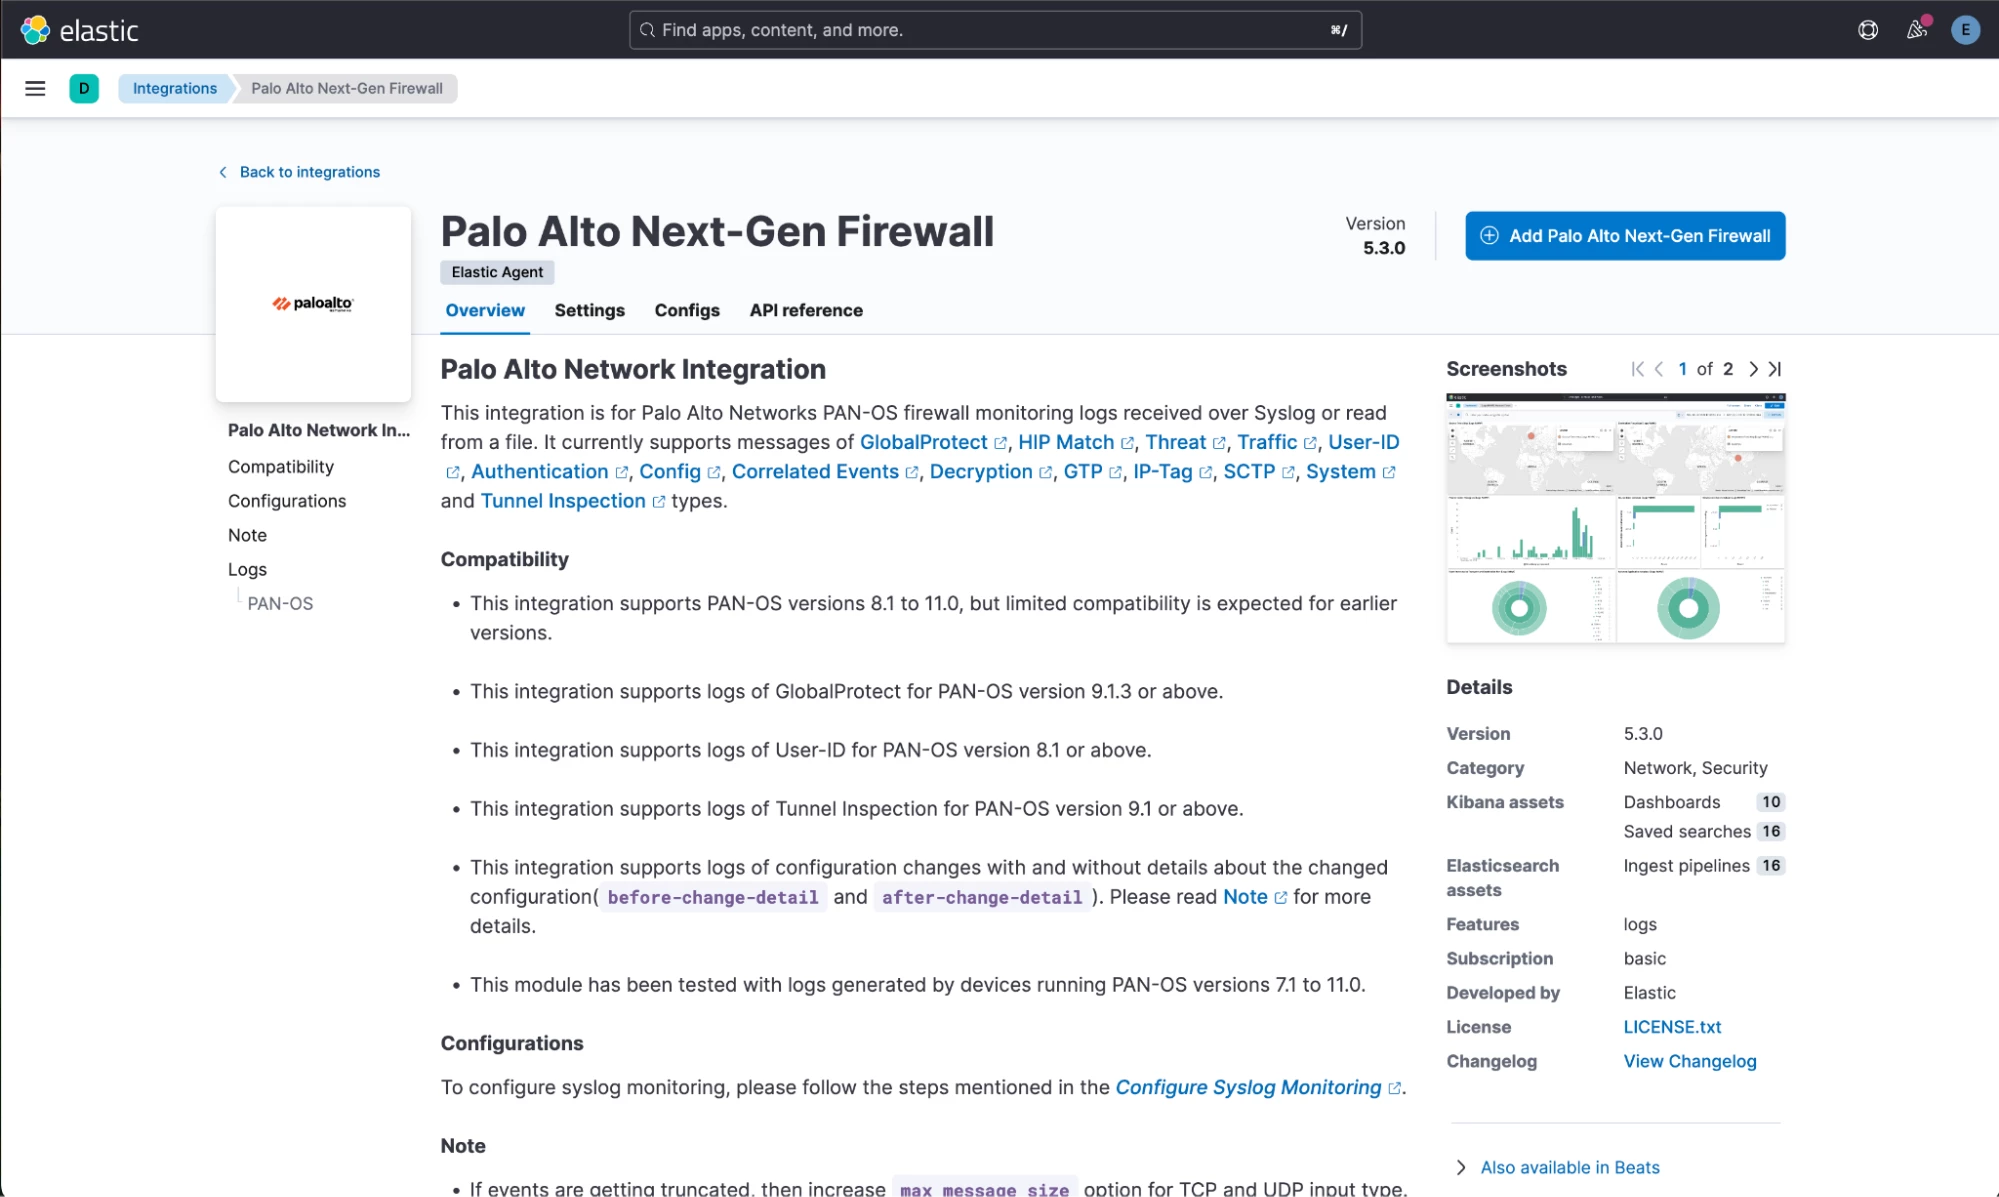
Let’s jump into Kibana and install the Palo Alto NextGen firewall integration. We will not add it to an agent because our setup doesn’t require agents. The data will be sent from Cribl Stream directly into Elasticsearch.
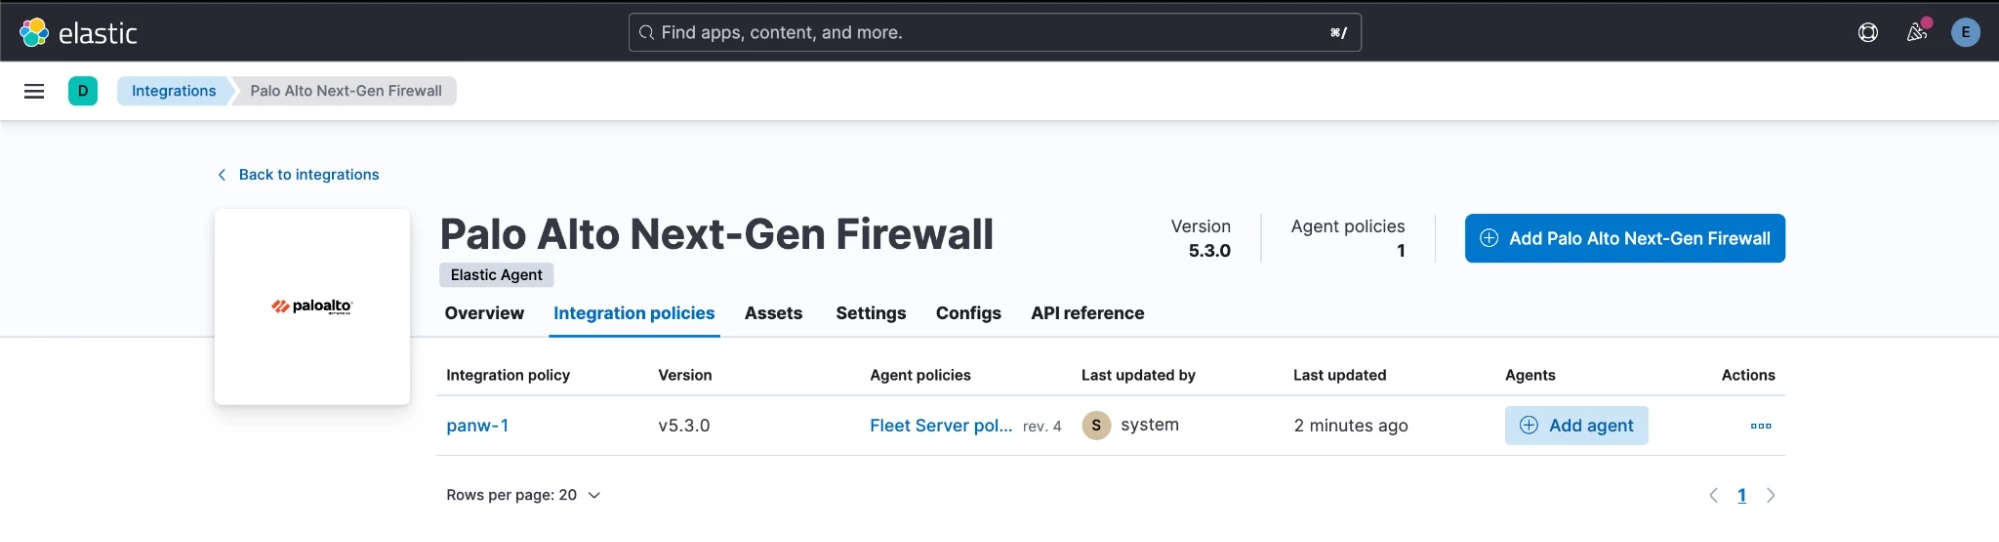
- Search and select Palo Alto Next-Gen Firewall integration from the Integrations menu under Manage. Click “Add Palo Alto Next-Gen Firewall”.
- Click “Save and continue” at the bottom without changing anything.
- Click “Add Elastic Agent later”. Remember, we are going to be using Cribl Stream data directly.
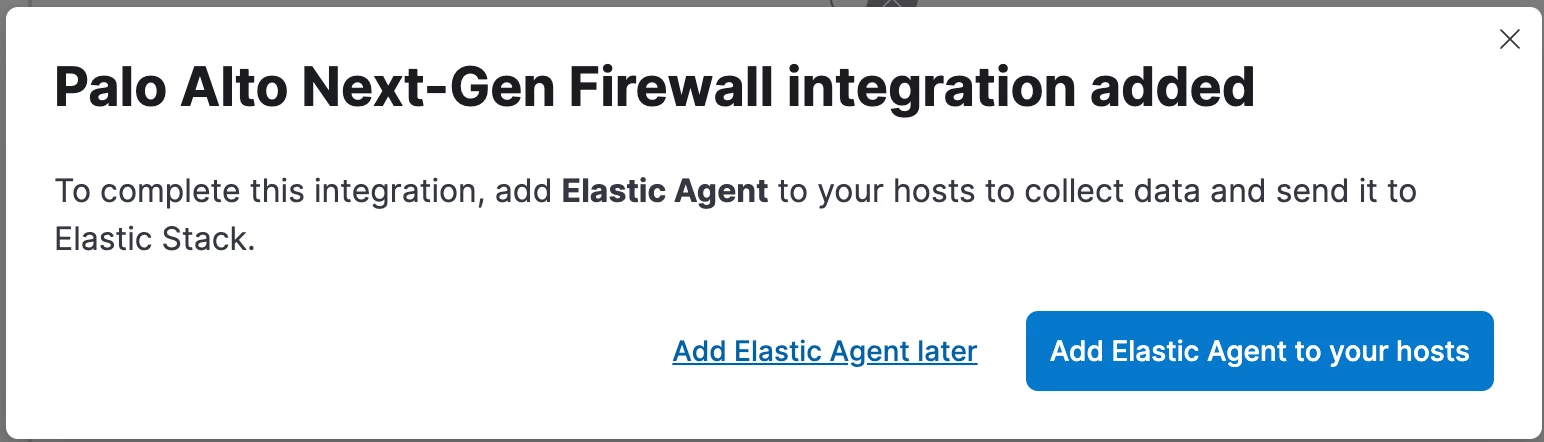
- Our PAN Firewall integration has been installed.
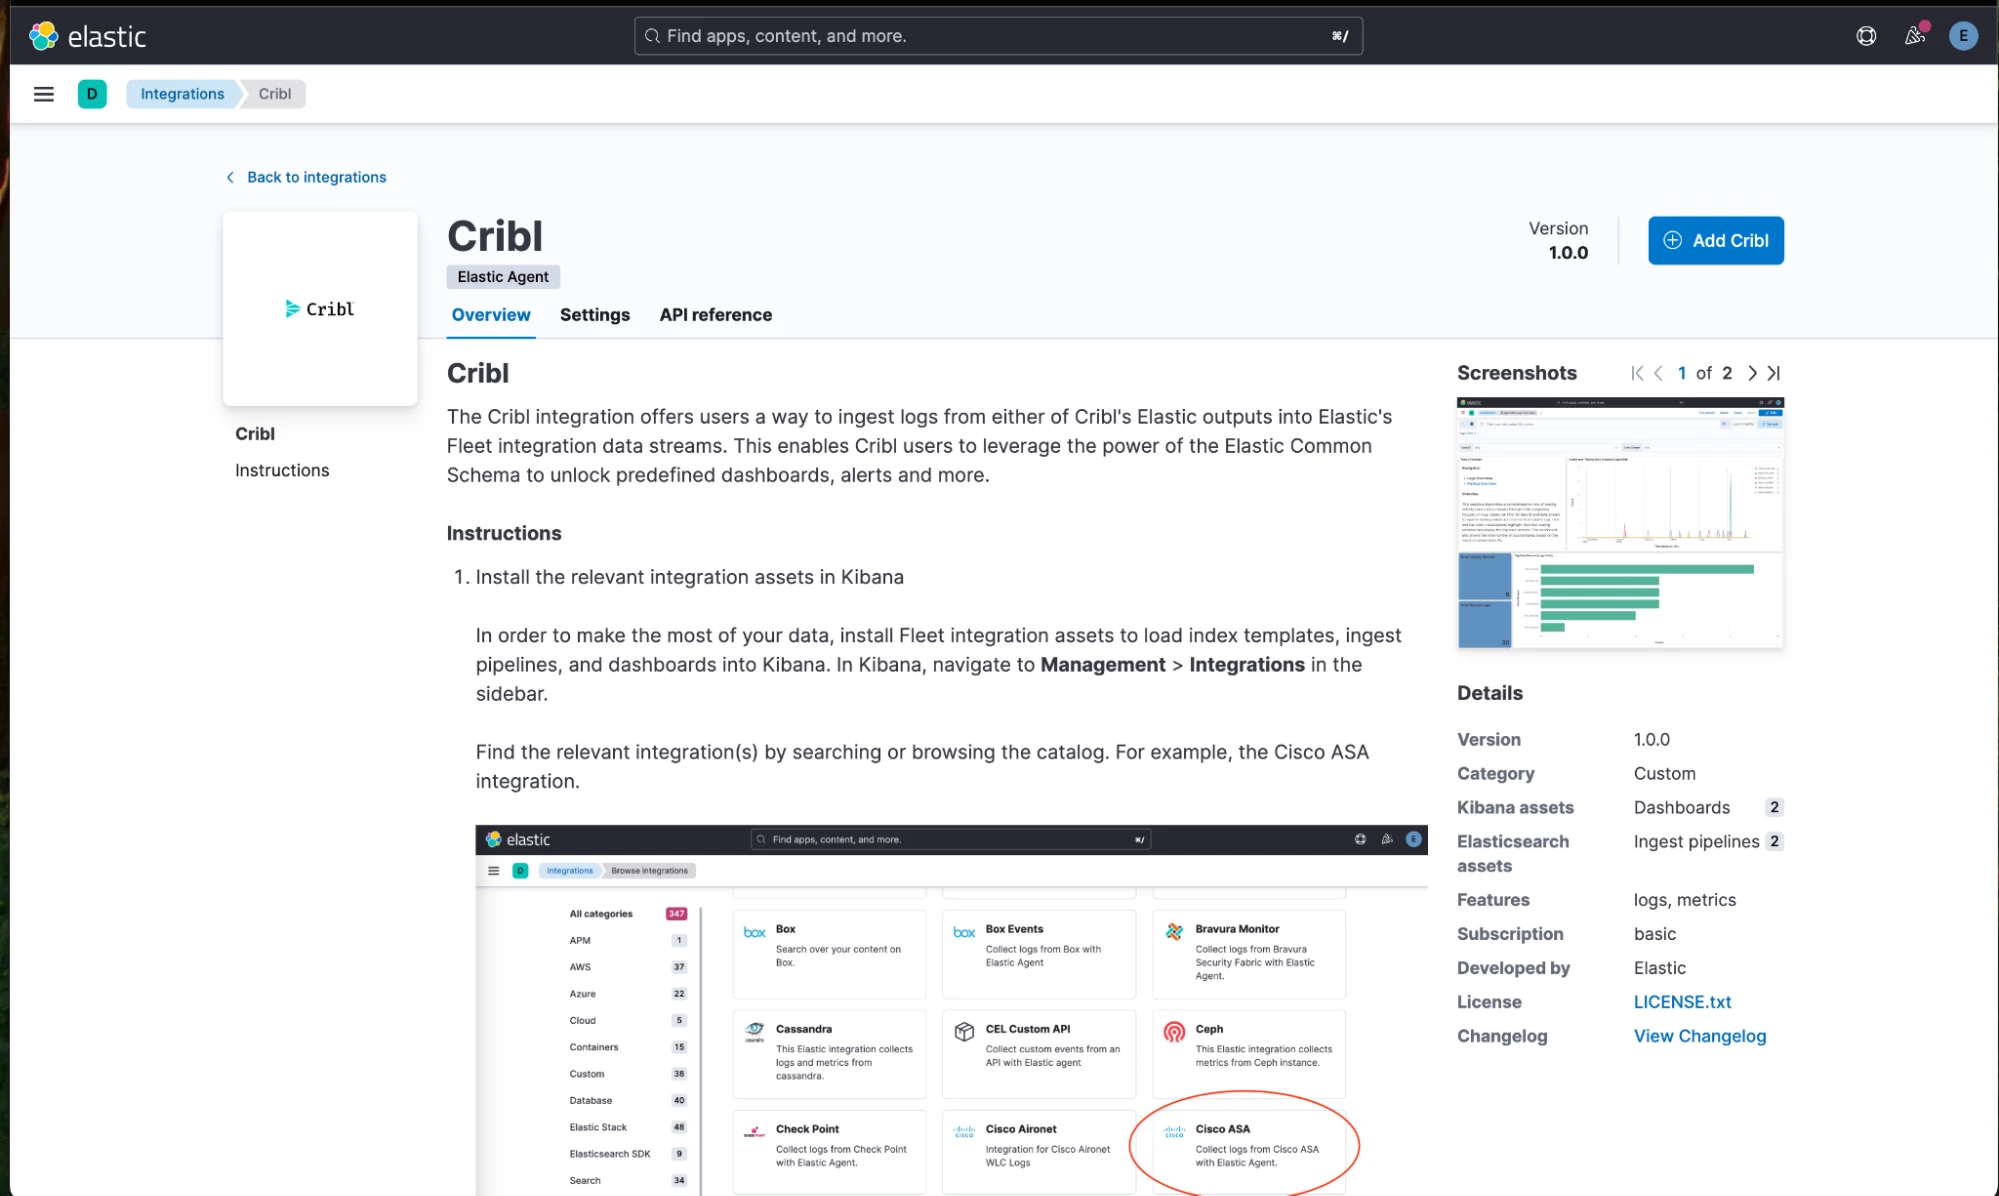
Let’s install the Elastic Cribl integration.
- Search and select Cribl in the integrations list. Click on “Add Cribl”.
- While we are at it, let’s configure the _dataId field to map the value 'pan' to logs-panw.panos datastream. This will activate the right Elastic integration for every message Stream sends with the value _dataId = 'pan'. Click “Save and continue”.
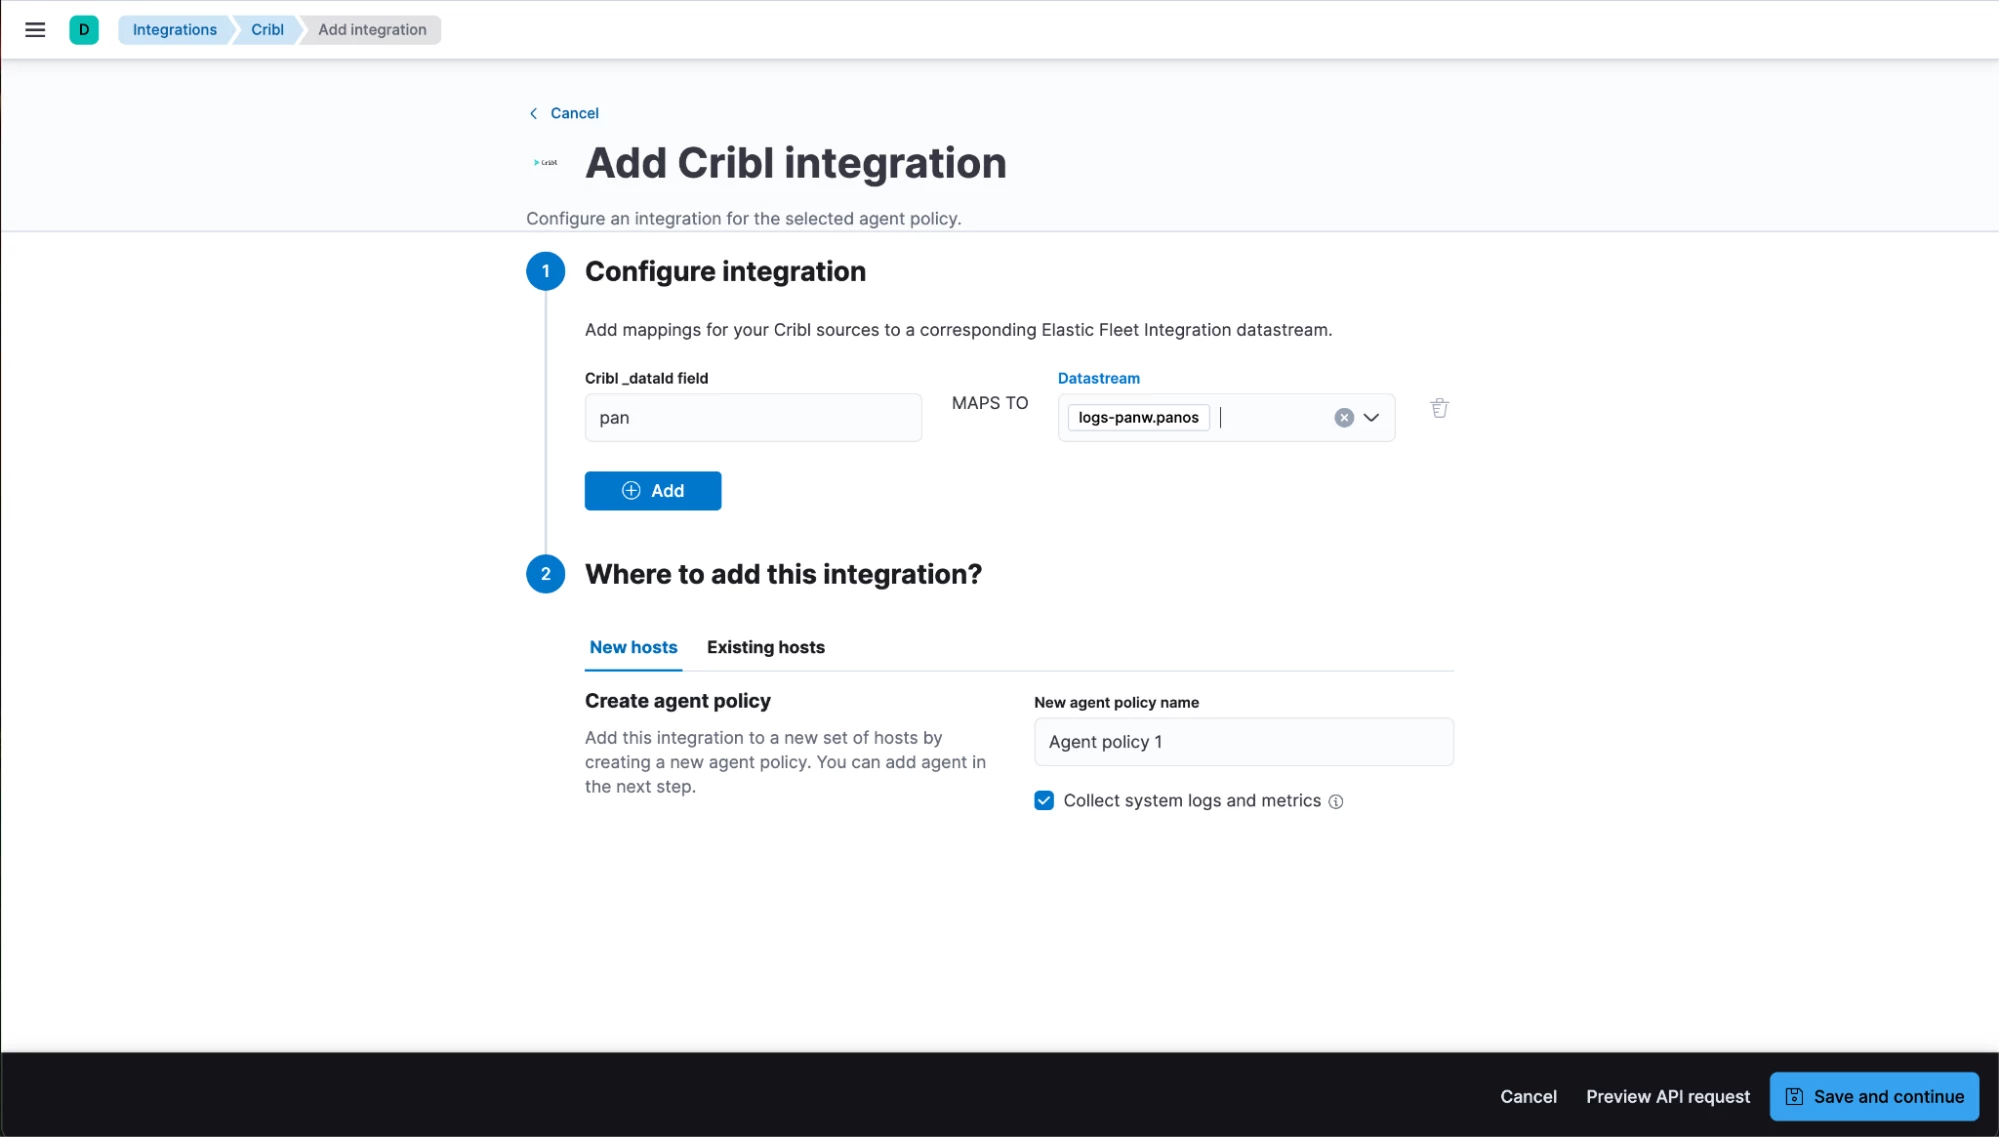
- Click “Add Elastic Agent later”. This integration doesn’t need an Agent.

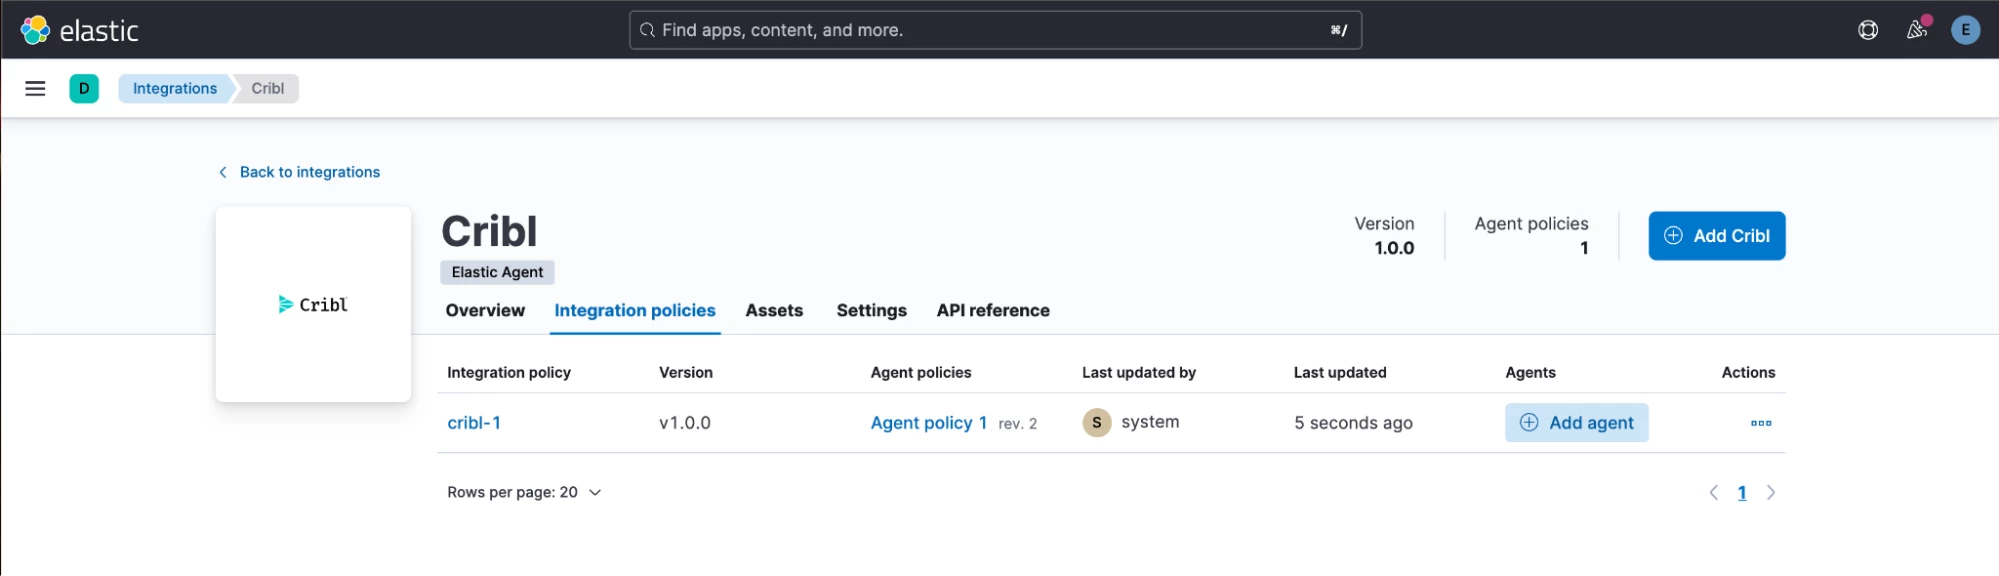
- Our Cribl integration has been installed.
Configure the Cribl Side
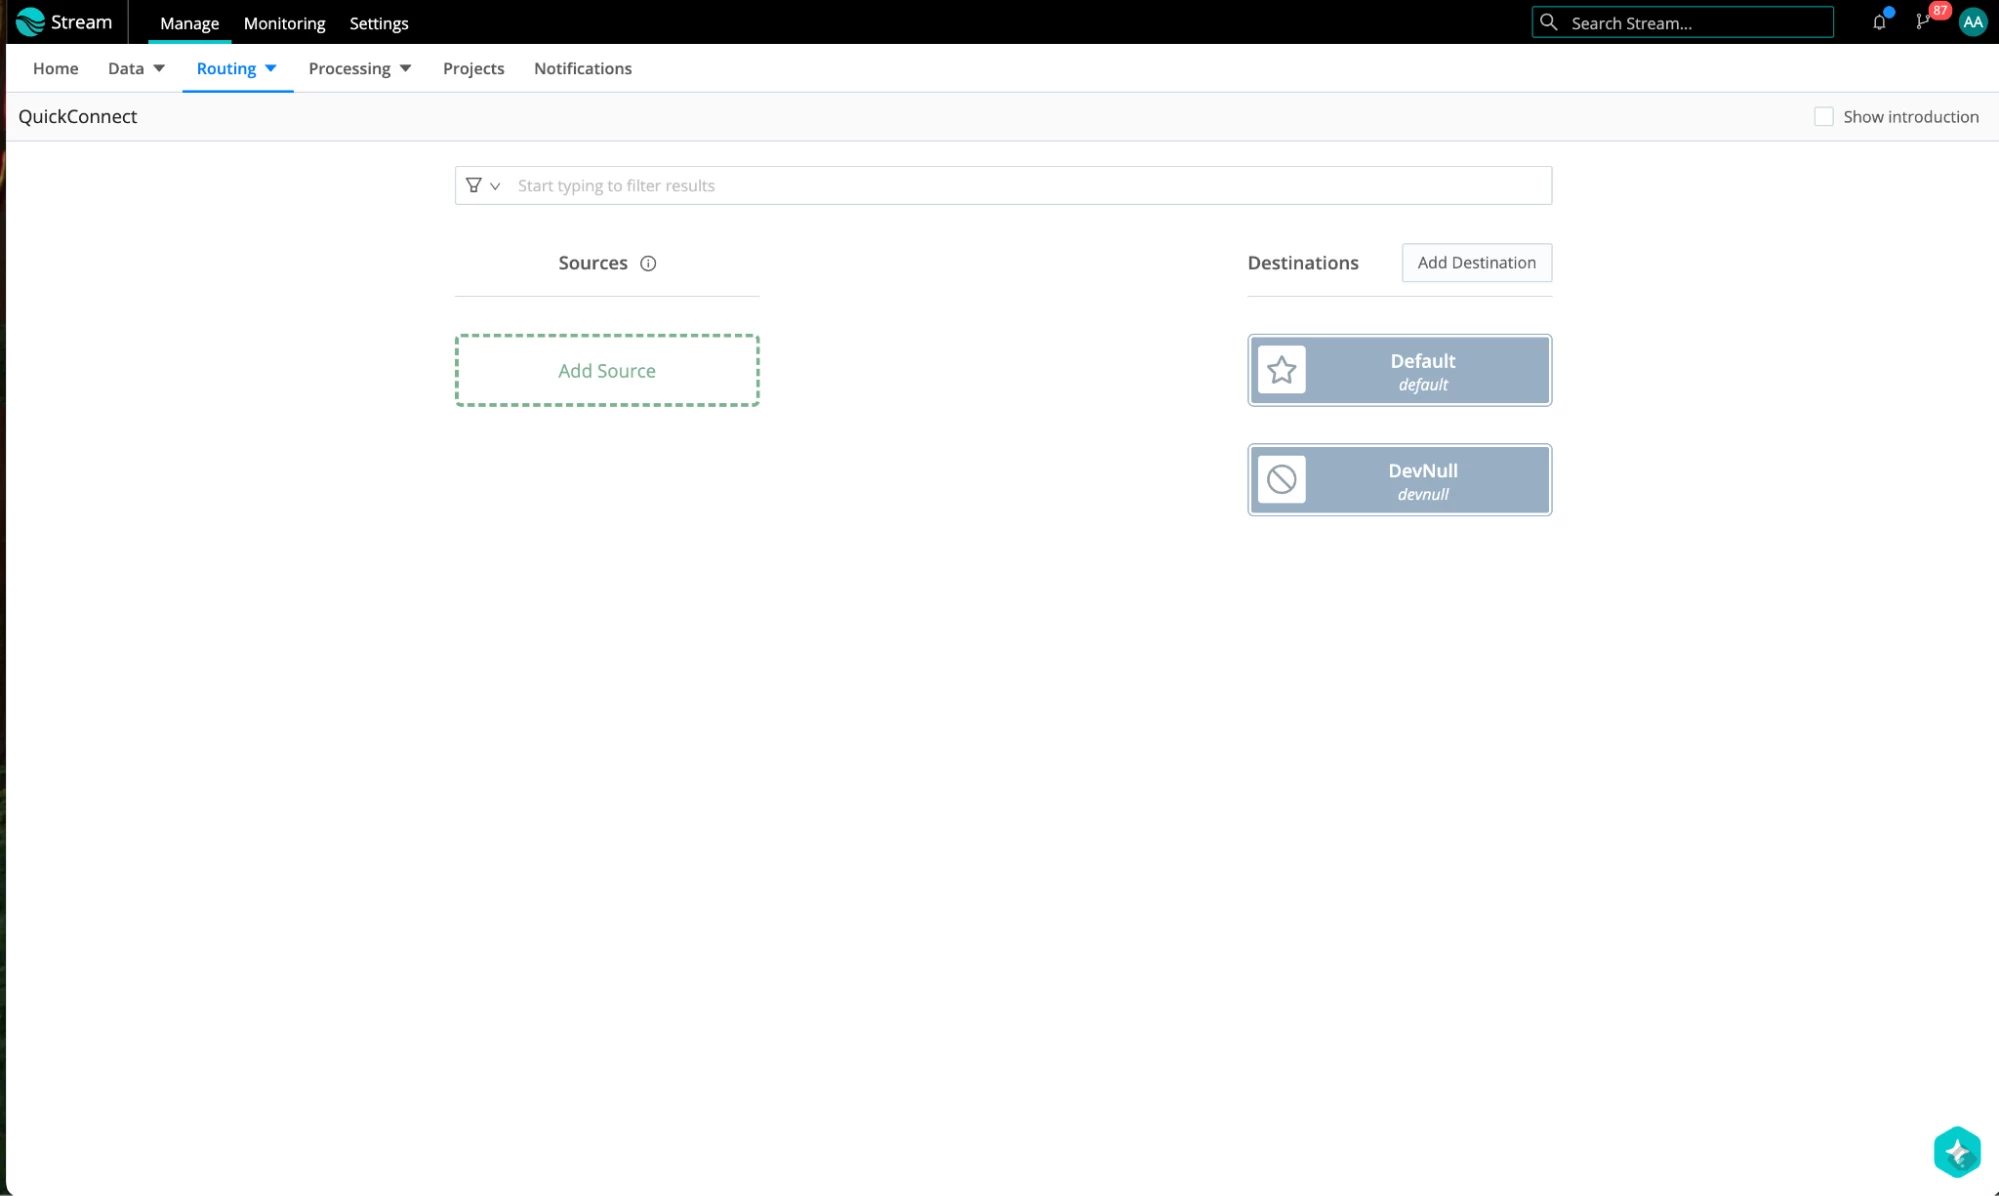
Go to QuickConnect. As a source, let’s configure a datagen that uses Palo Alto NextGen Firewall TRAFFIC data as our source. This source will set the _dataId field to the value ‘pan’.
- Add a new source.
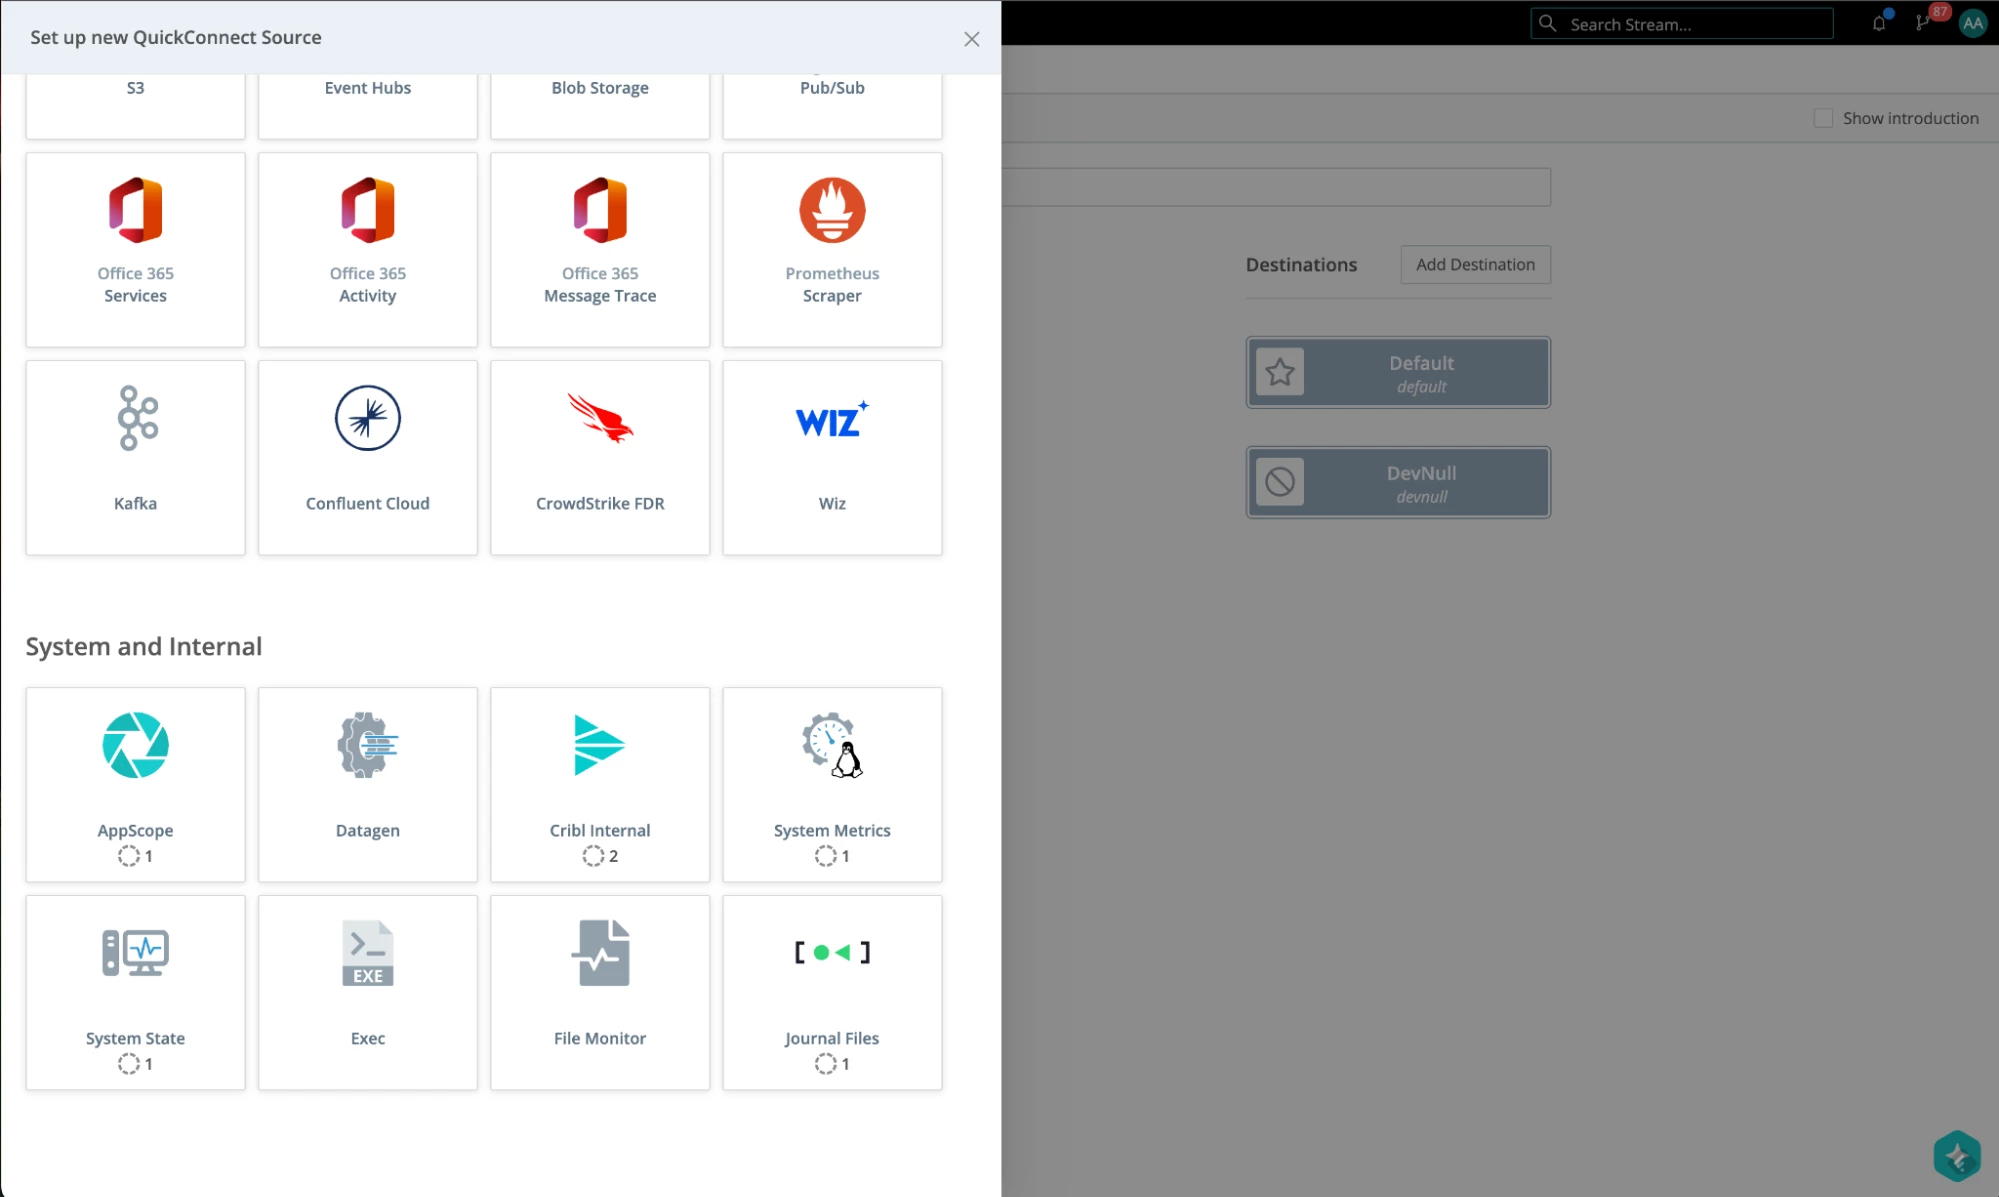
- Select Datagen.
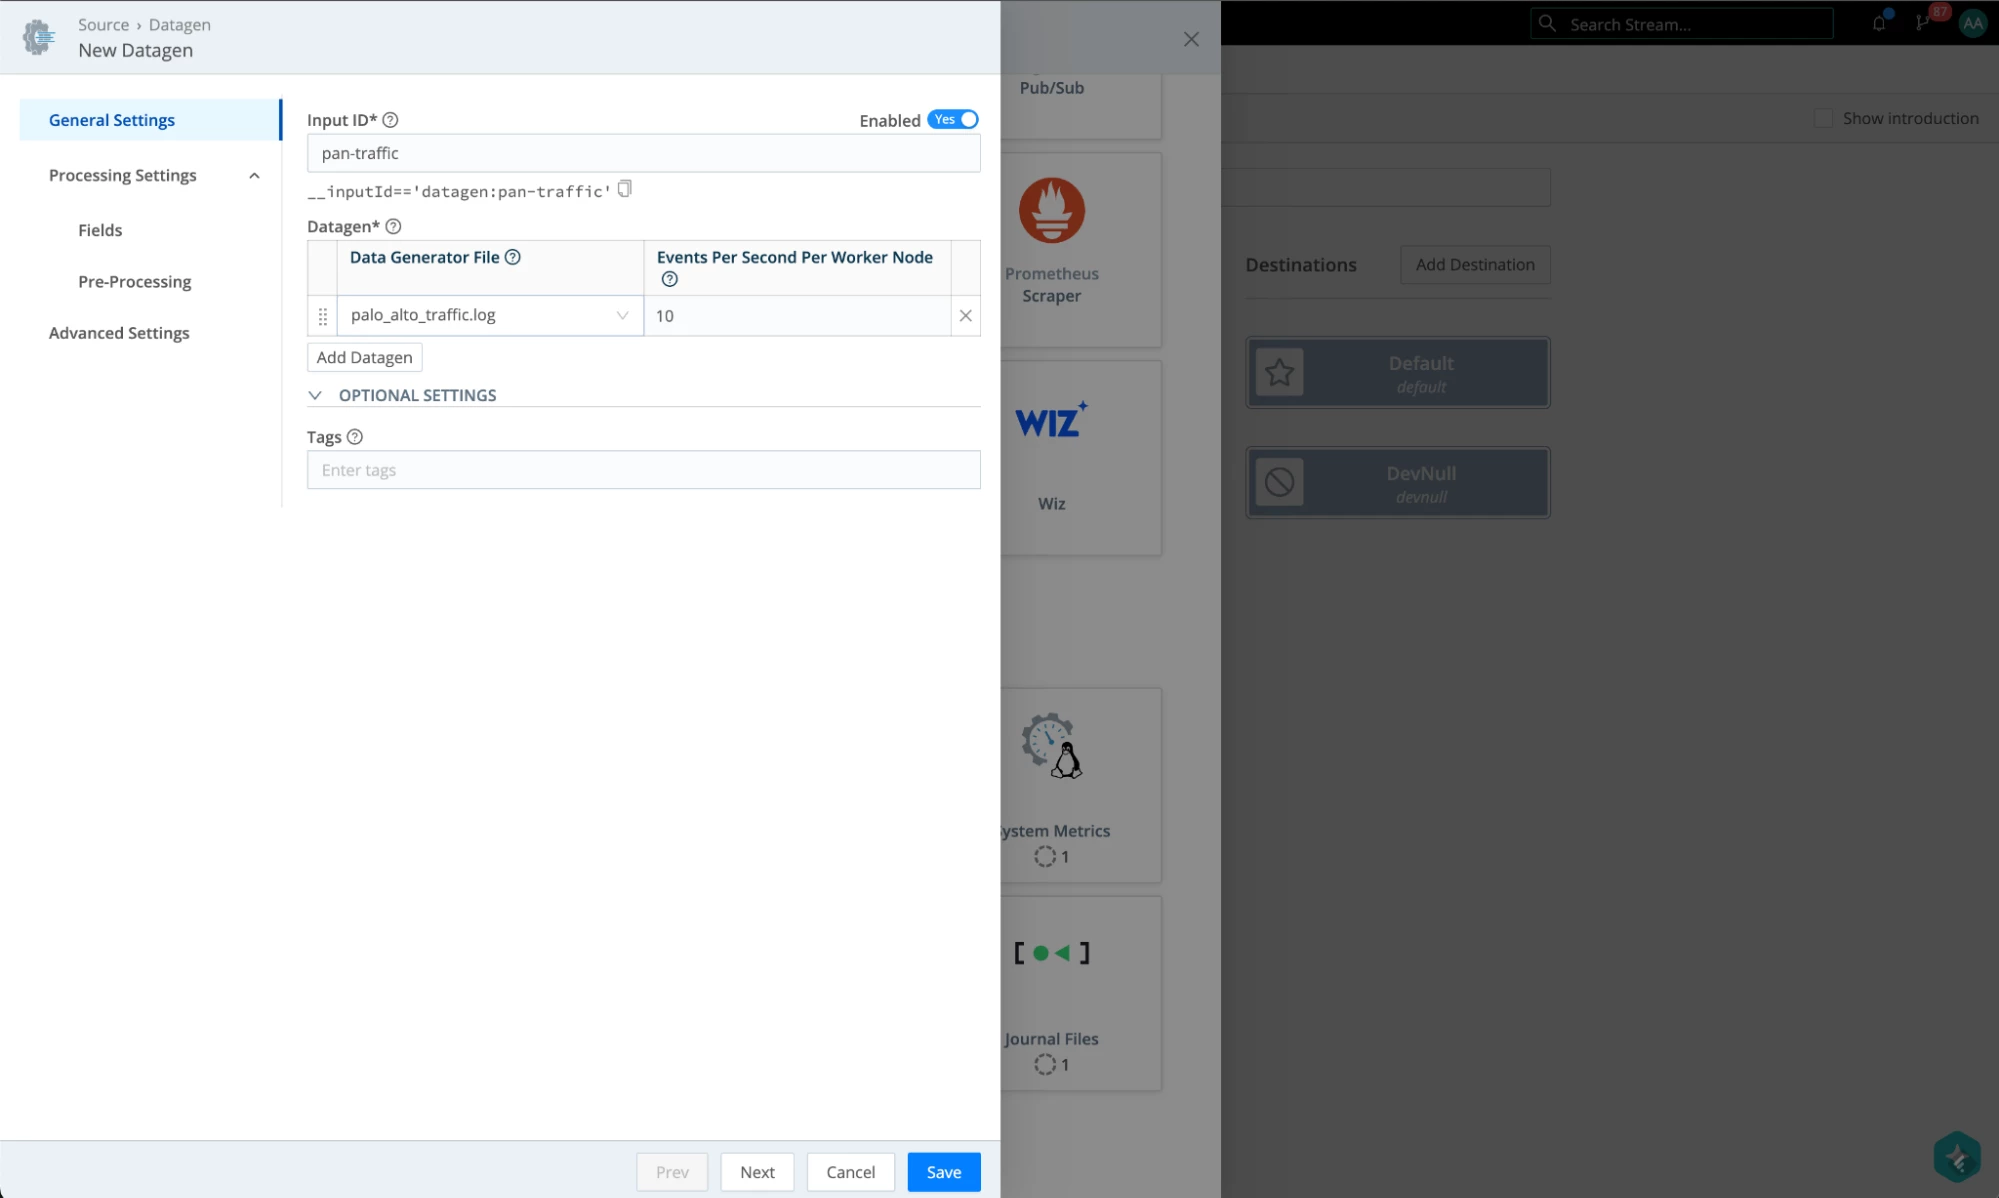
- Configure it with palo-alto-traffic.log, leaving the rest as defaults, and give it a name.
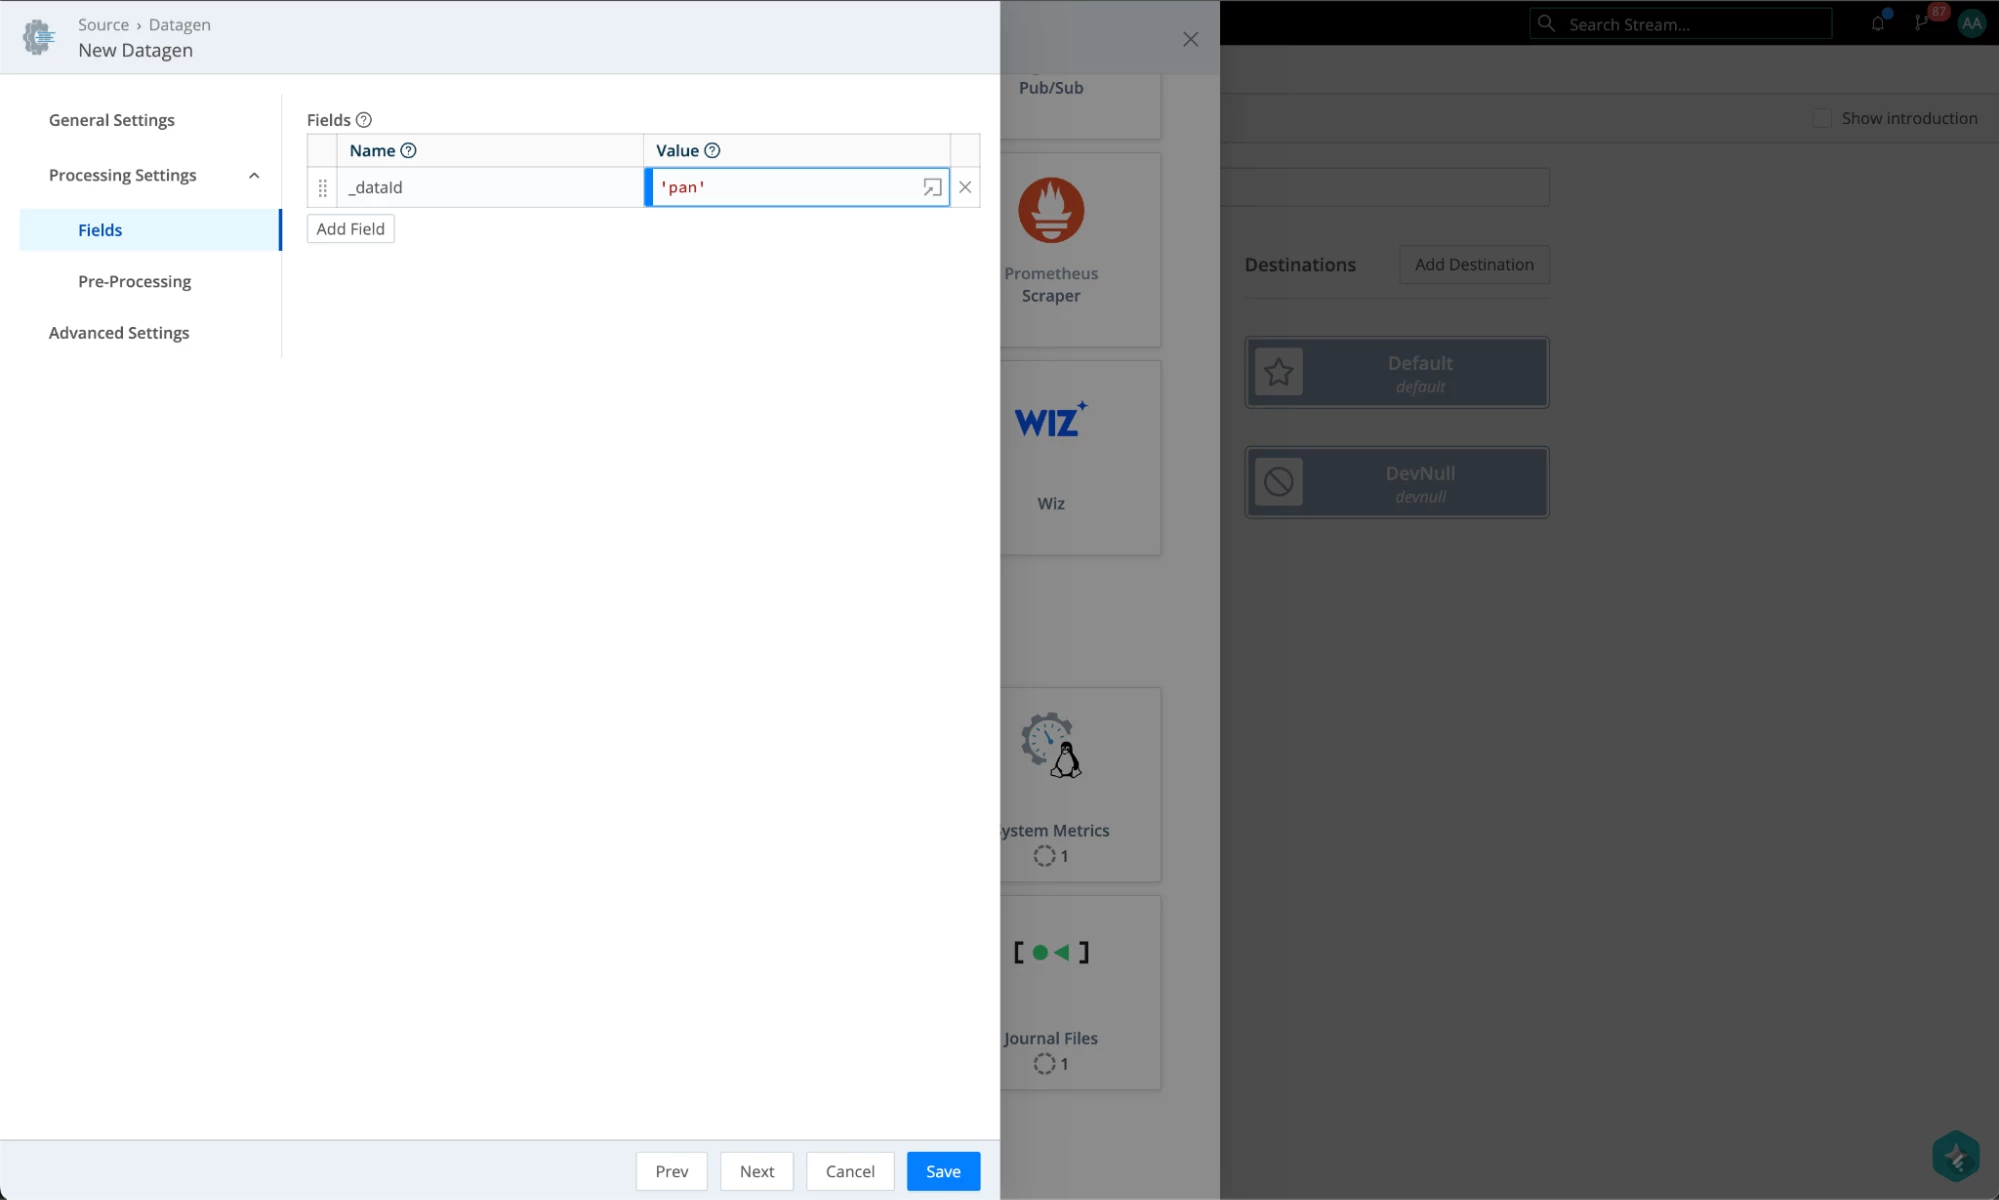
- Under Fields, add a _dataId field and give it a value of ‘pan’. It can be anything, but it will have to match the setting we have configured in Kibana for that data stream. Hit Save when done.
Let’s create an Elasticsearch Destination where the data will be sent. Note the index we are sending the data to: logs-cribl-default. This will not be the data stream where the data will land. It will be overwritten by Cribl integration and the mapping we configured between the data stream and the value in the _dataId field.
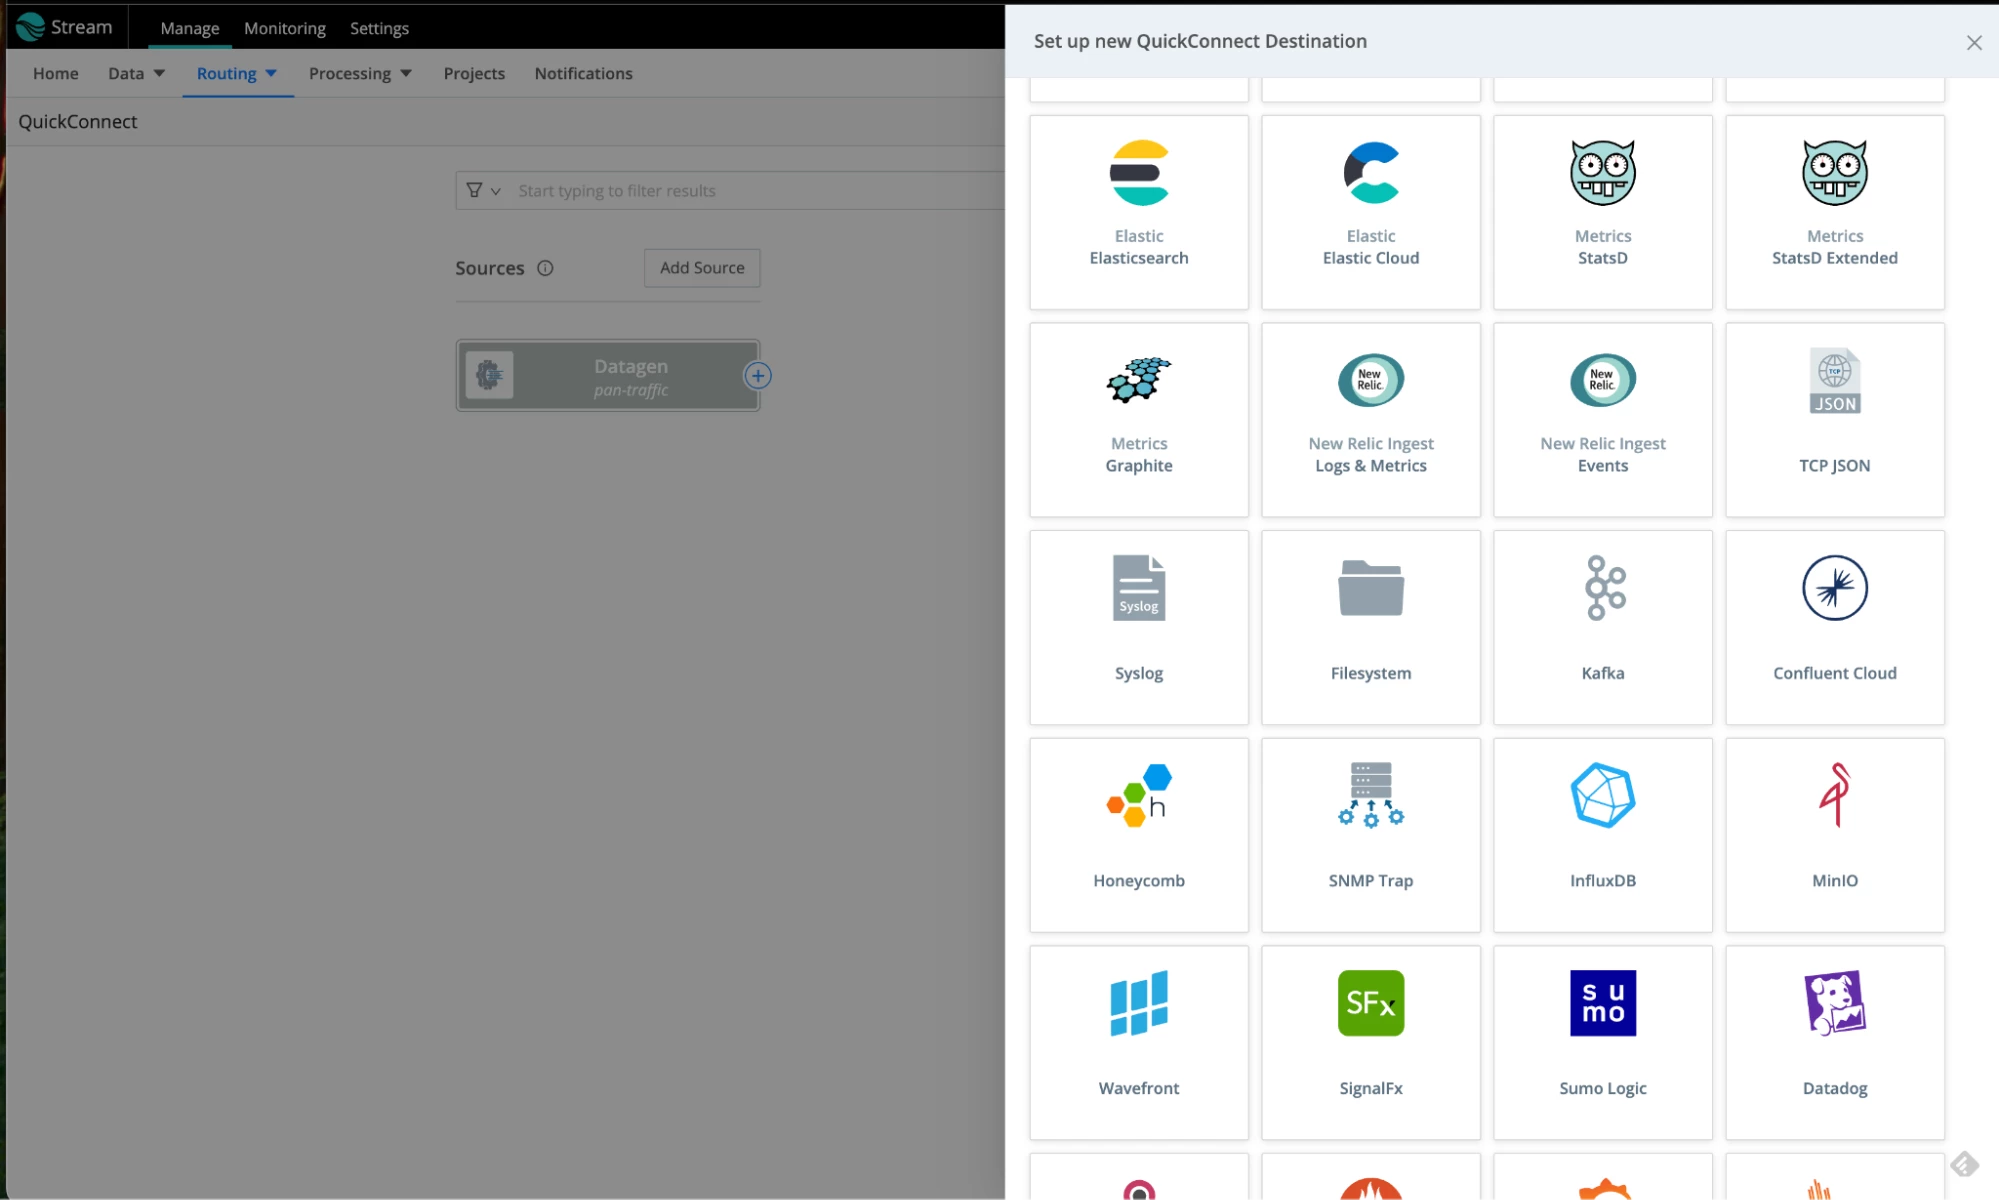
- In the QuickConnect screen, click on “Add Destination”. Select the Elasticsearch tile.
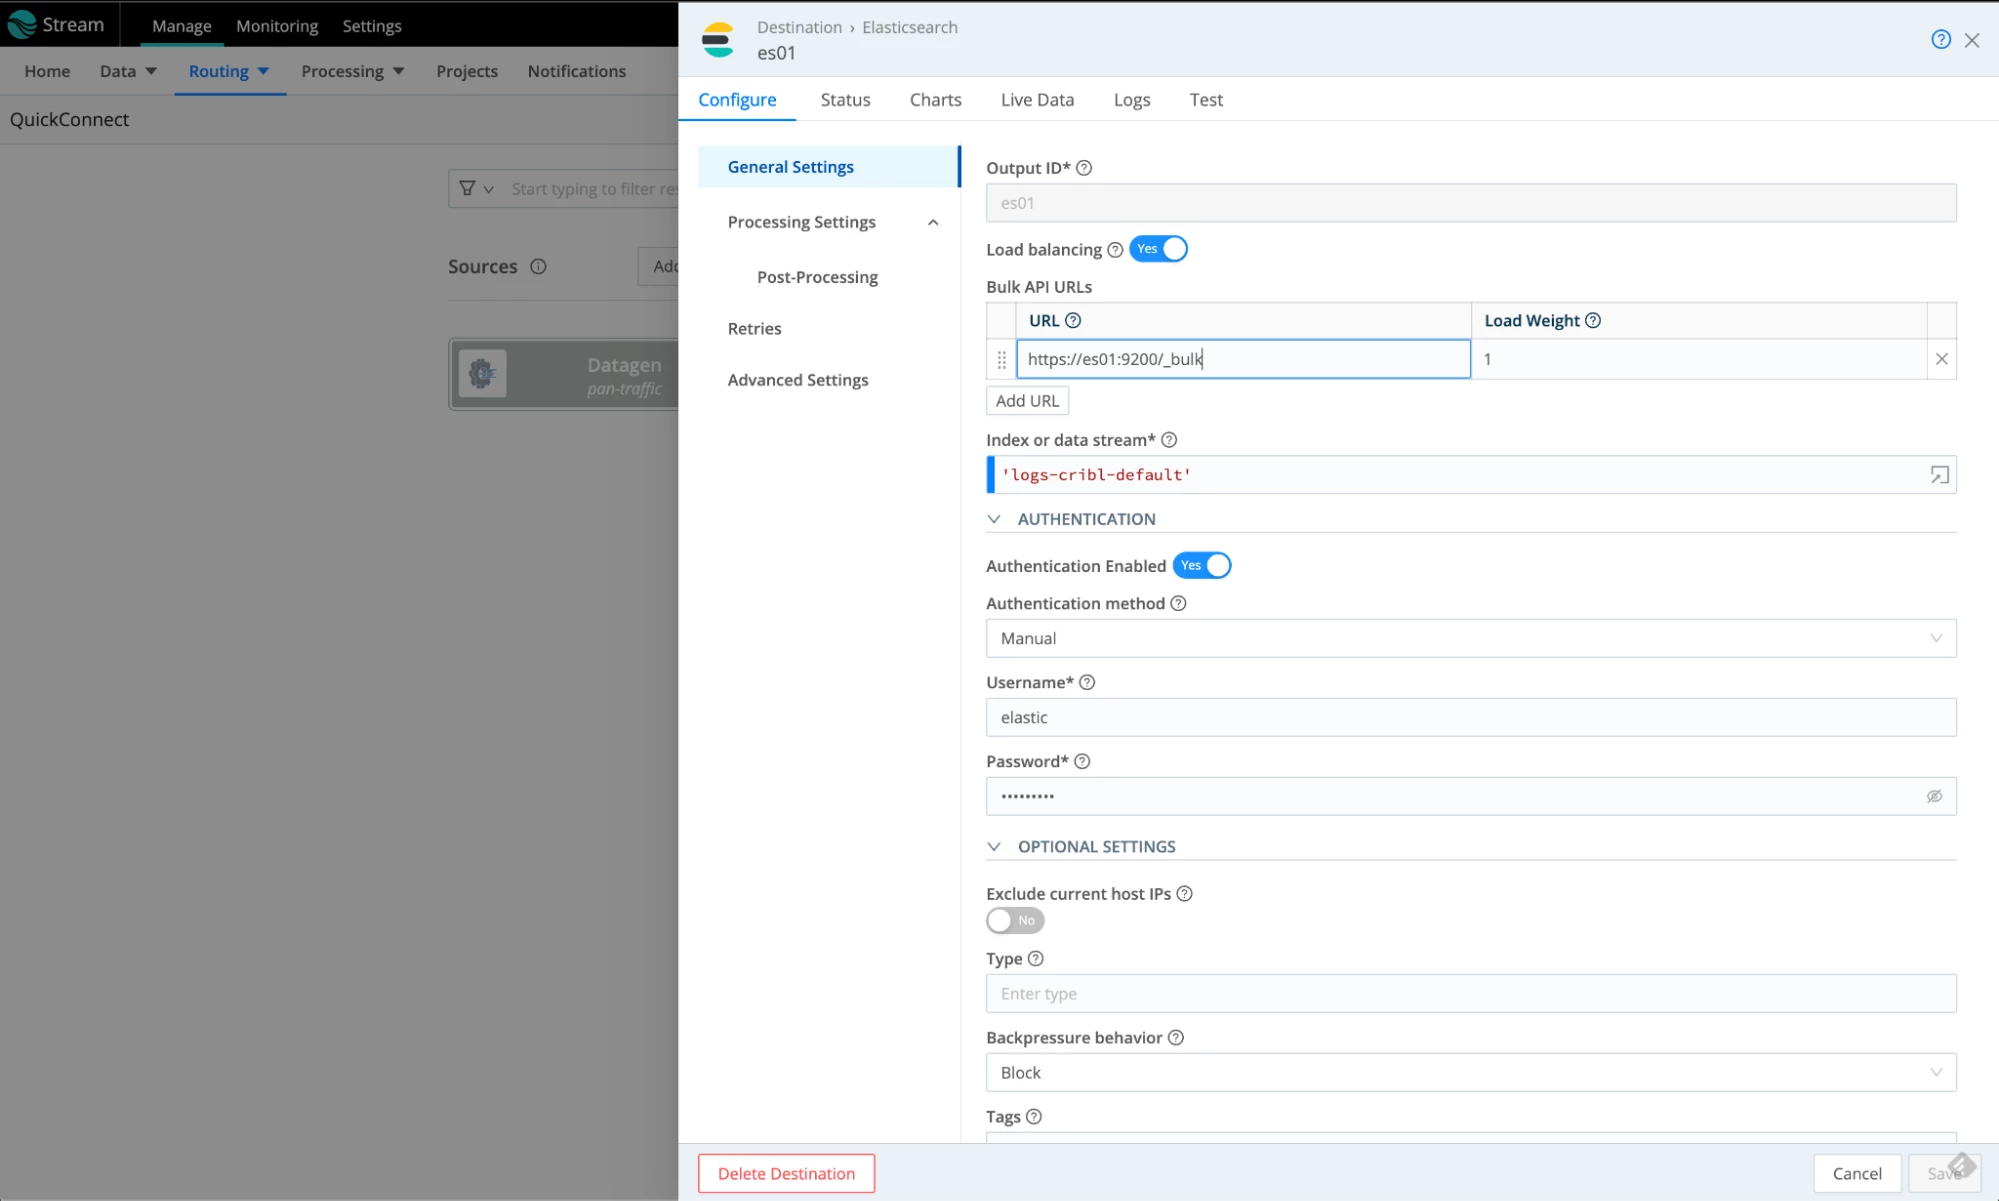
- Use the following values to configure the Elasticsearch destination:
- Name: es01
- Bulk API URLs: https://es01:9200/_bulk
- Index or Data stream: 'logs-cribl-default'
- Authentication method: Manual
- Username: elastic
- Password: cribldemo
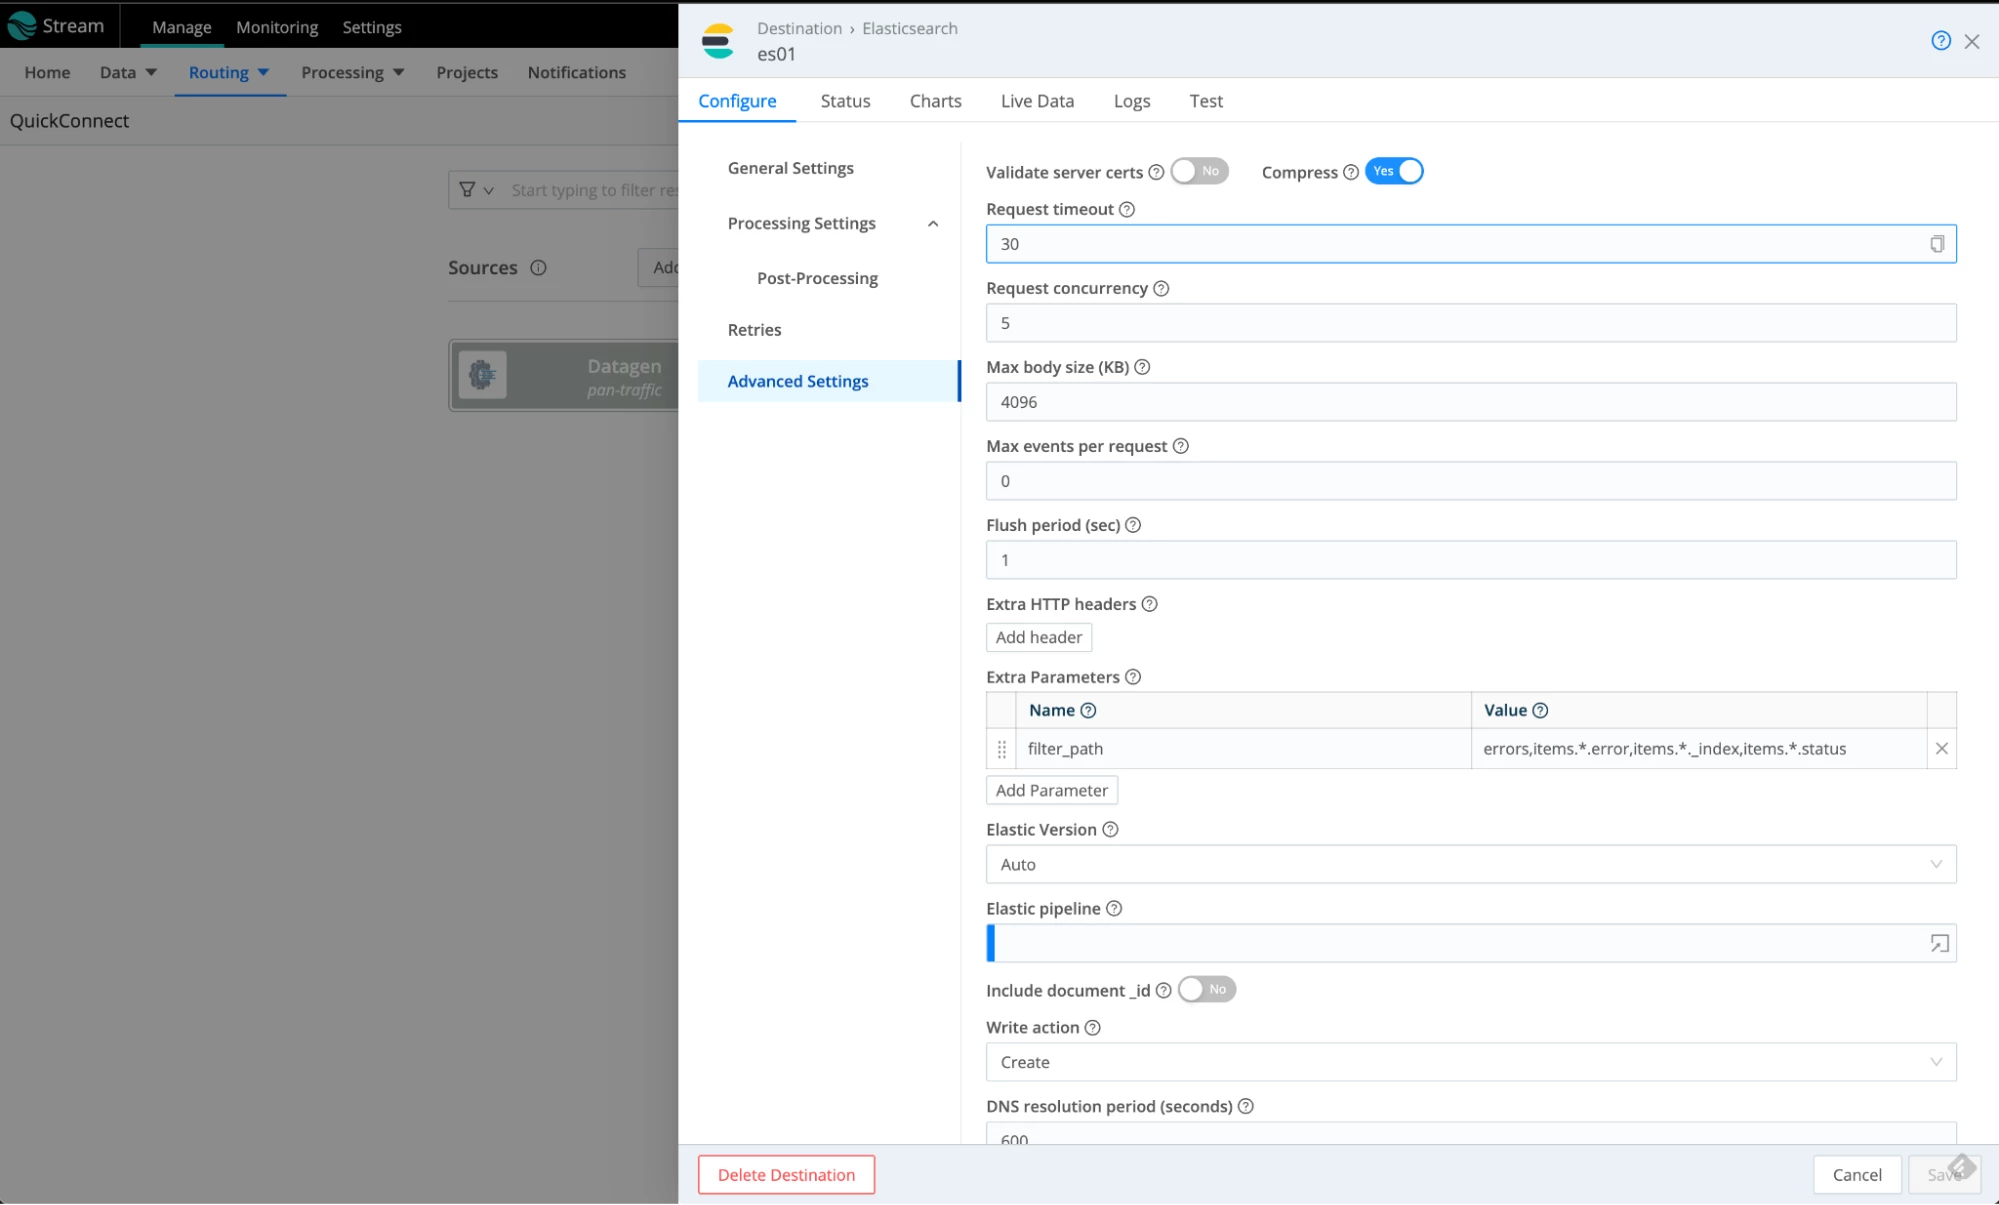
- Under Advanced Settings, disable the certificate validation. Don’t do it in production; this is just to get the demo going. Click Save when done.
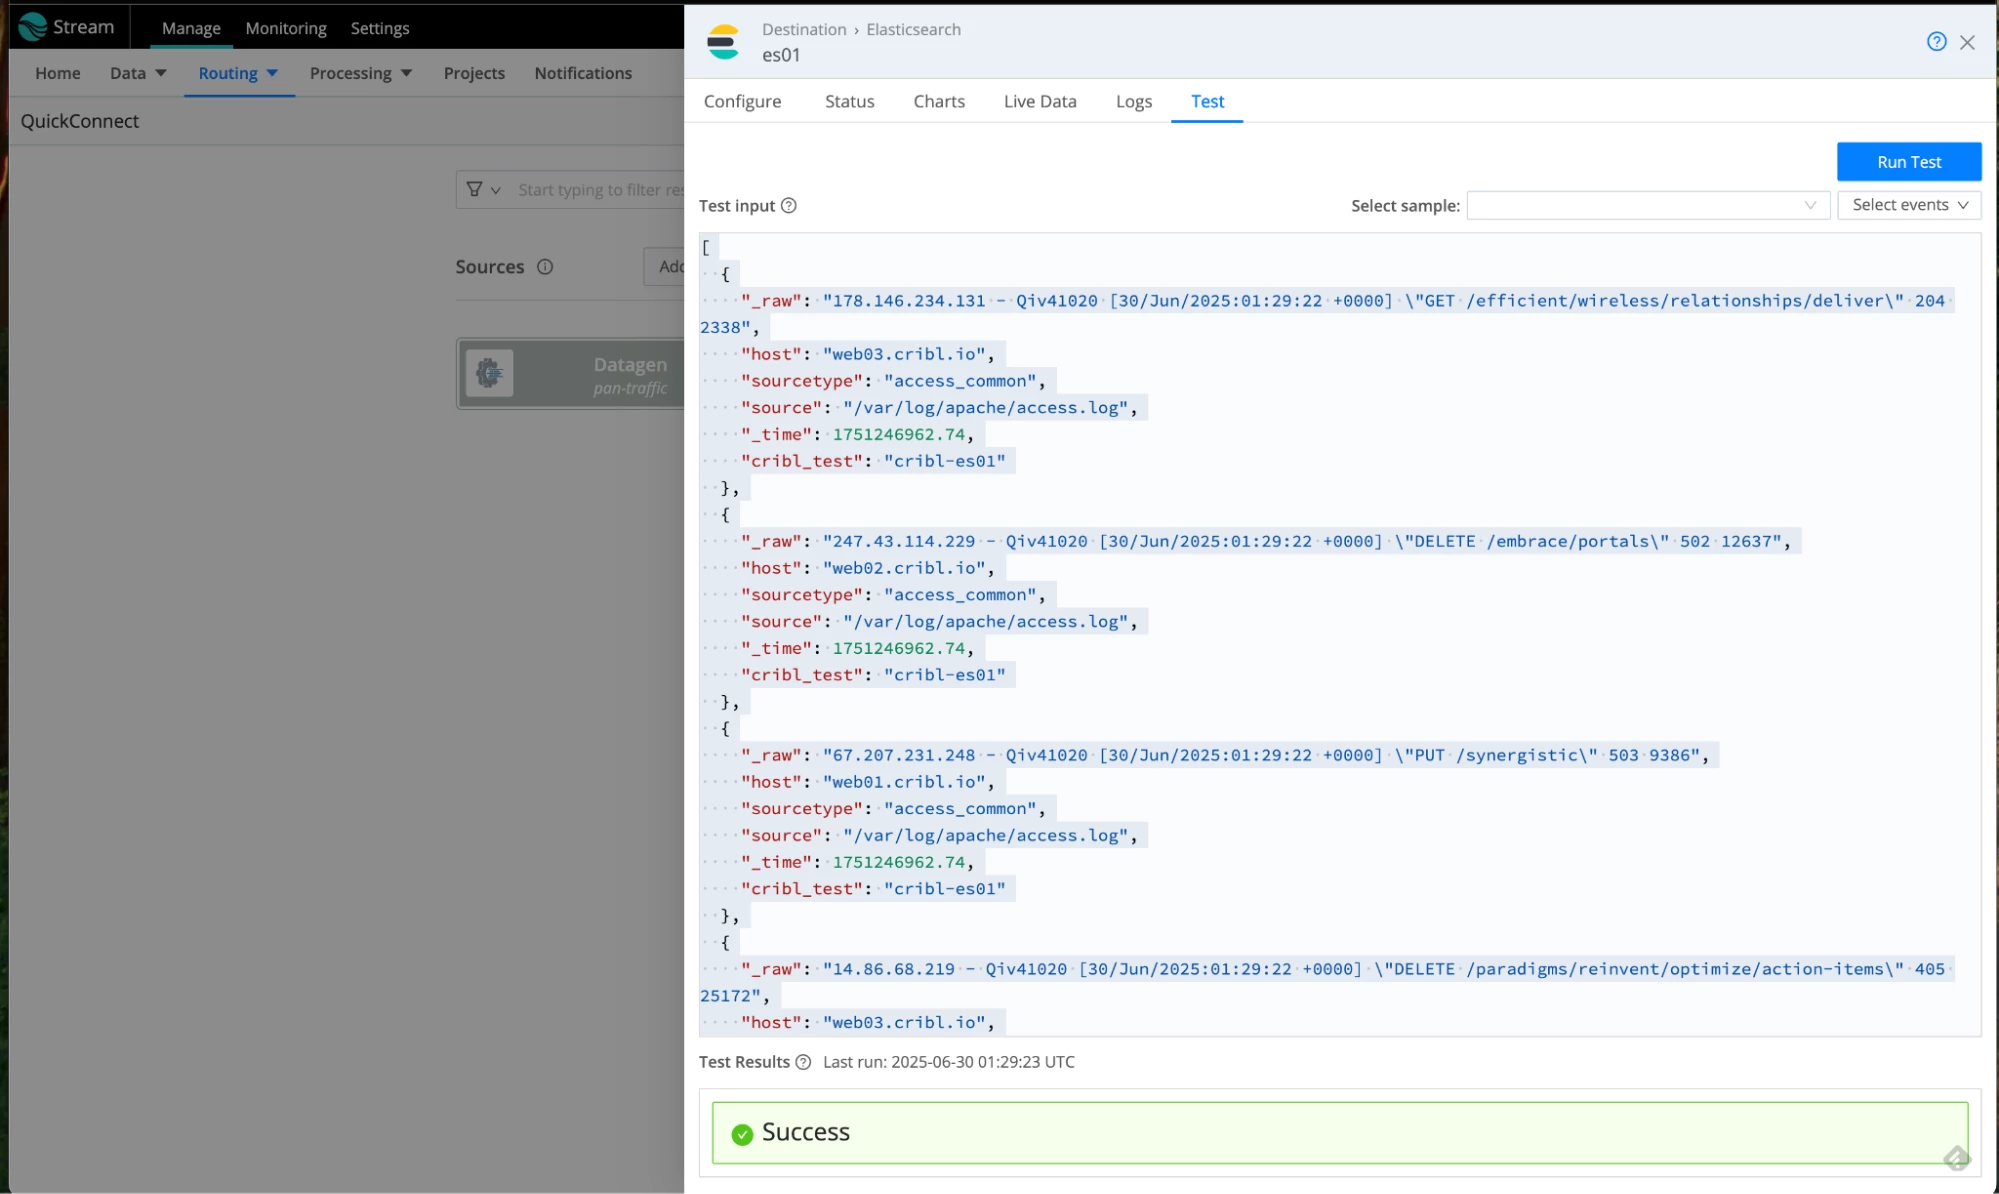
- Saving the dialogue will close the form. Open it again and test the connectivity to Elasticsearch using the Test tab. Click on Run Test. It should give you a green Success banner at the bottom. Close the dialogue when done.
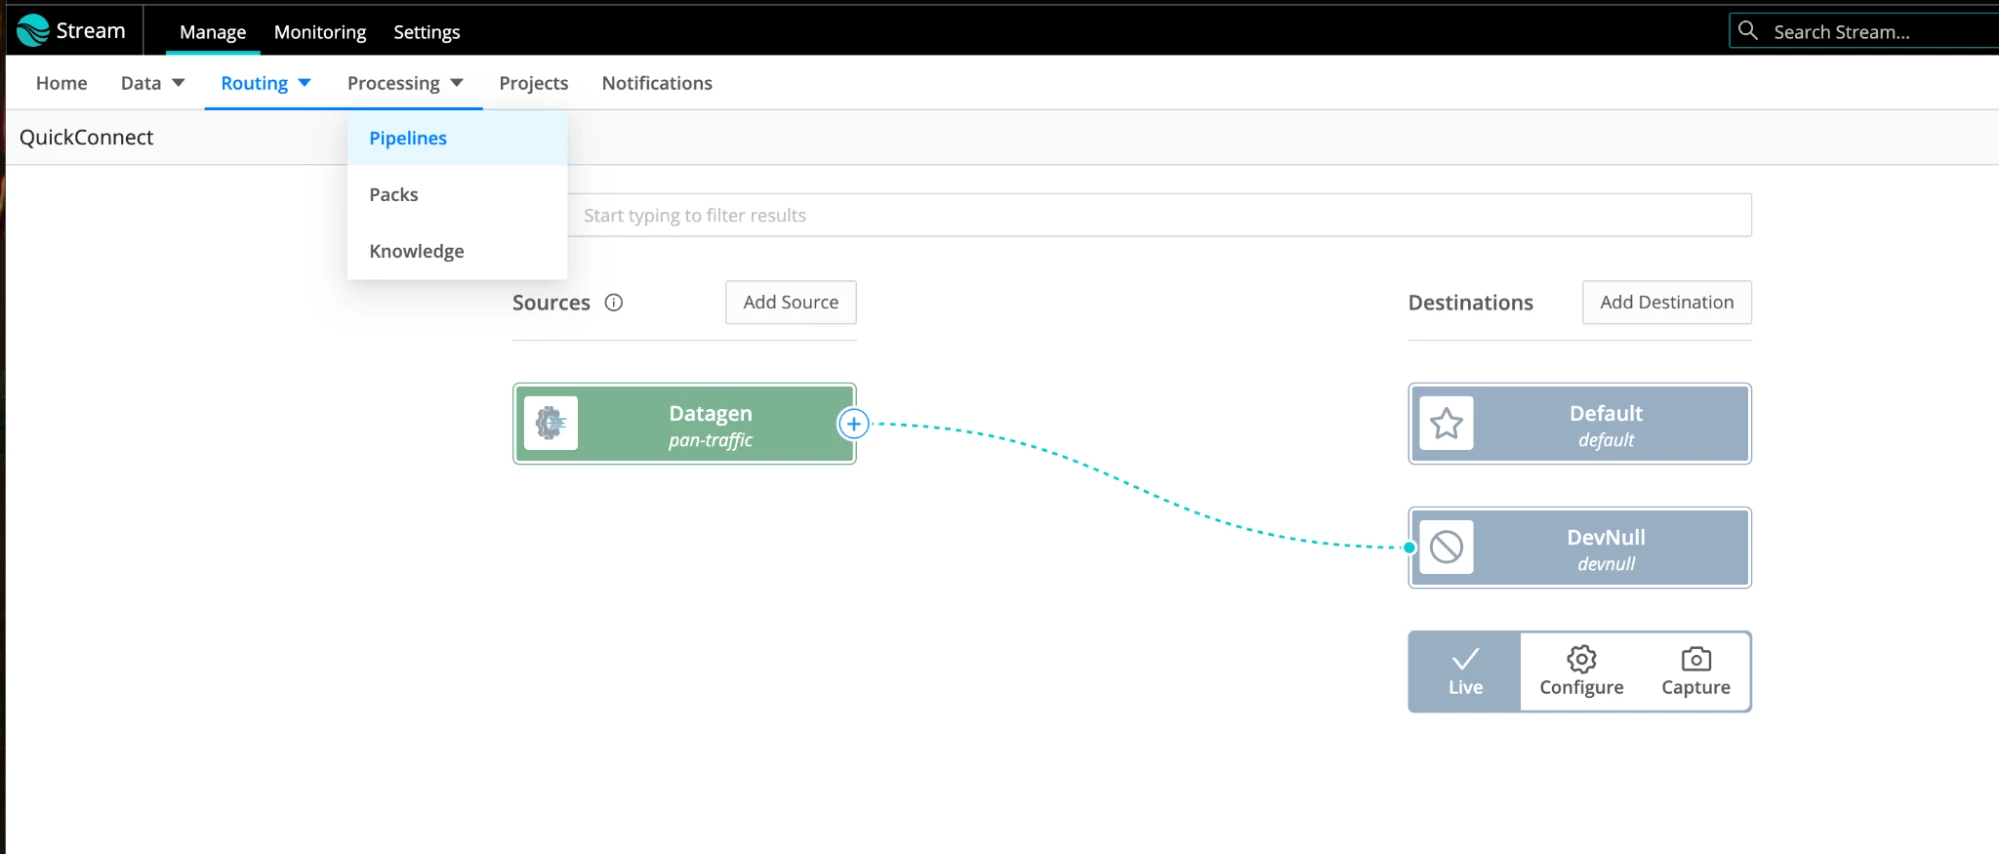
- There is one more thing. Let’s temporarily route our traffic to a devnull destination. Click and drag the “+” sign next to the datagen source and drop it at the devnull destination. Accept the passthrough option. This is what it will look like:

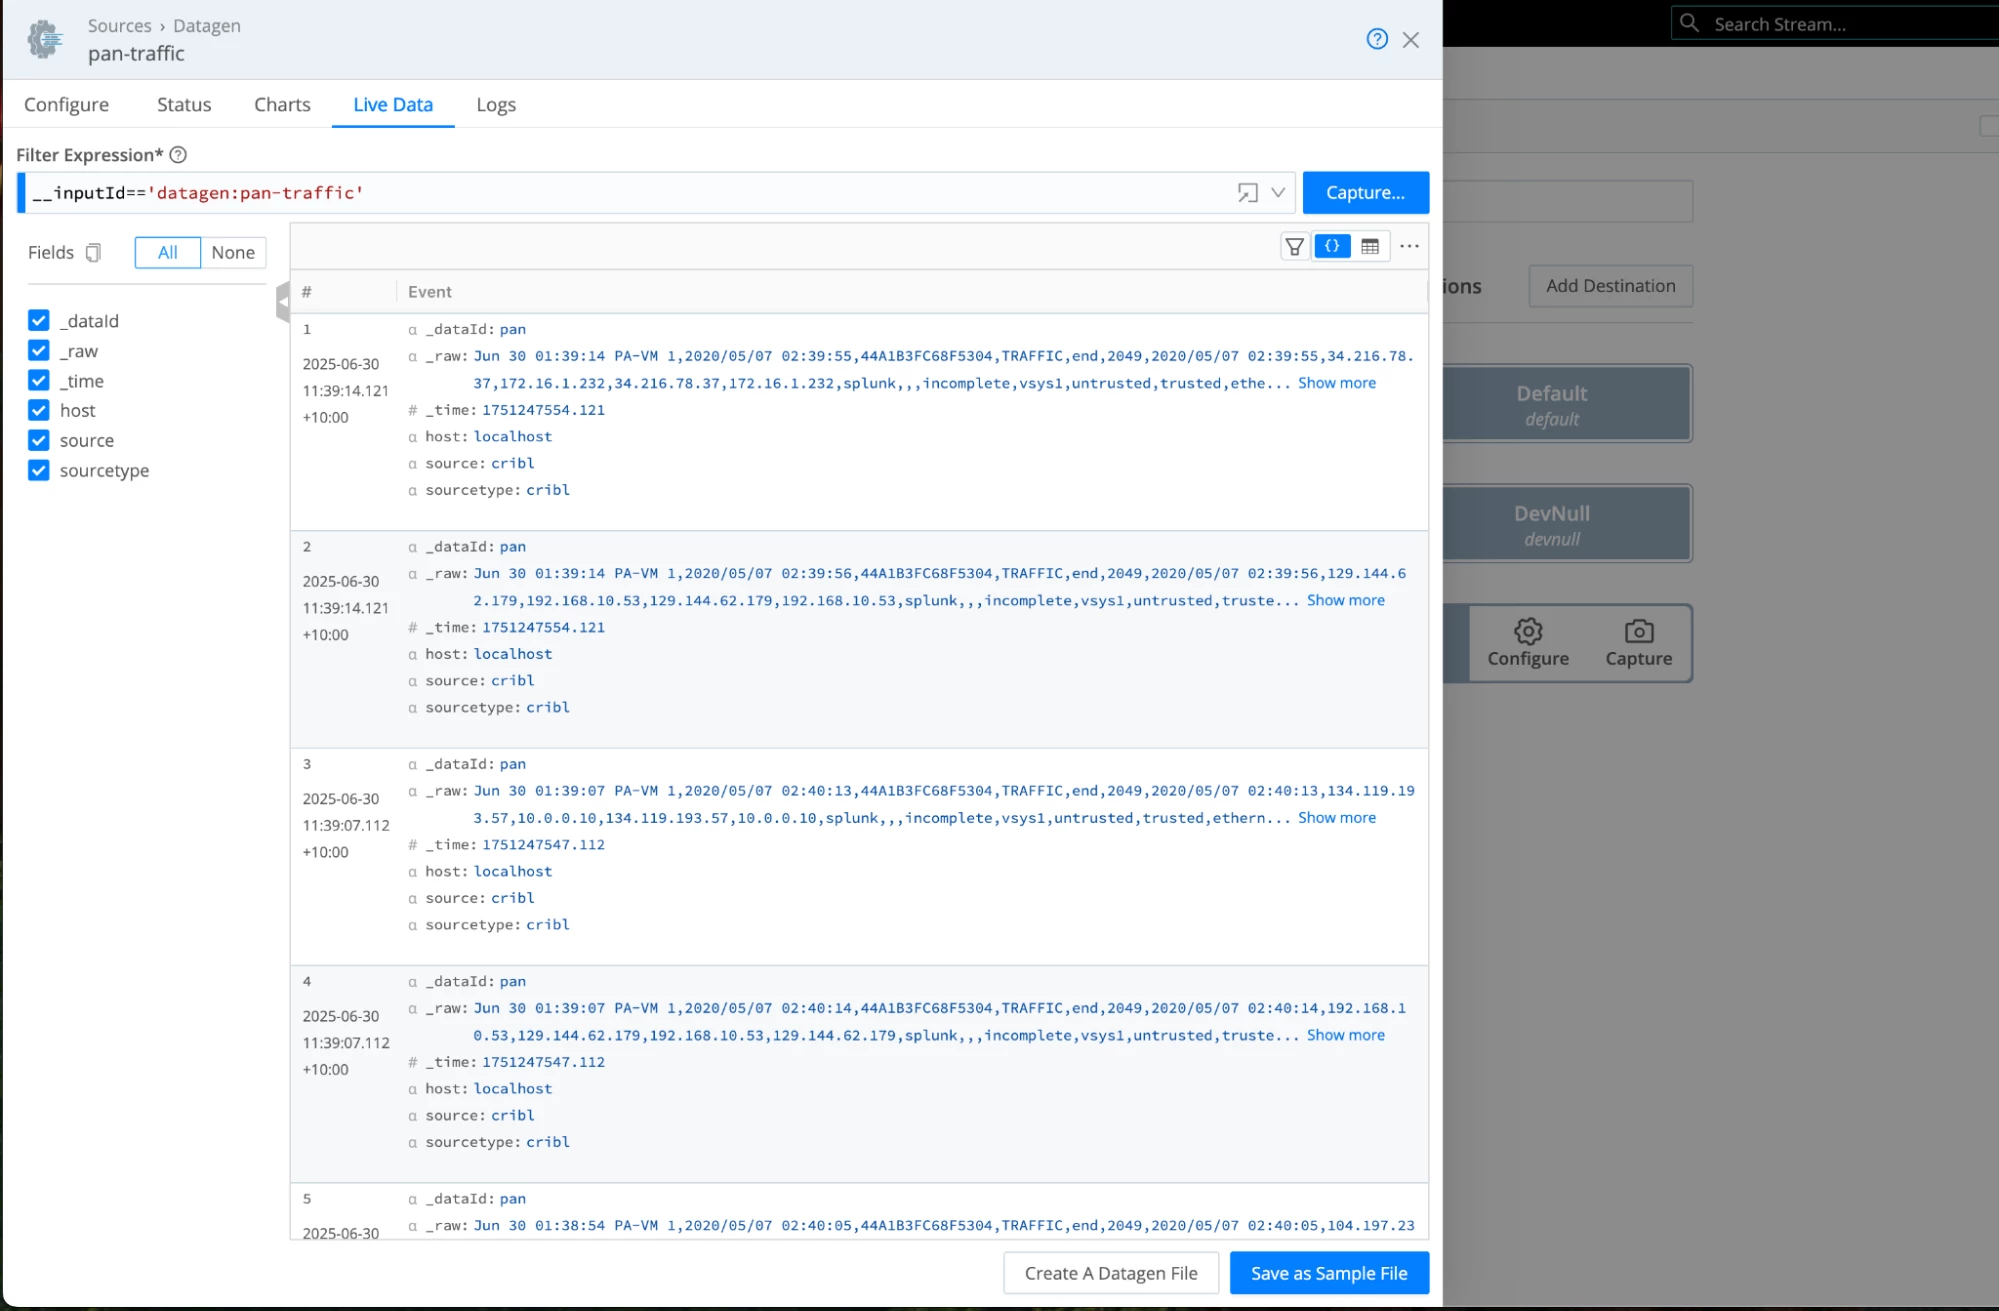
- This will allow us to capture and inspect the traffic. Hover over the datagen source and select the Capture option.
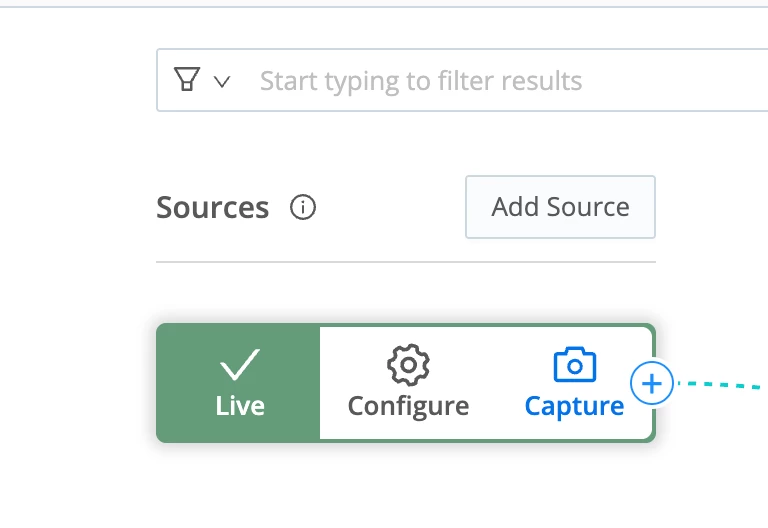
- This will show us the data generated by the source. This awesome feature of Cribl allows you to see your data in all its glory as it flows through your data pipelines!
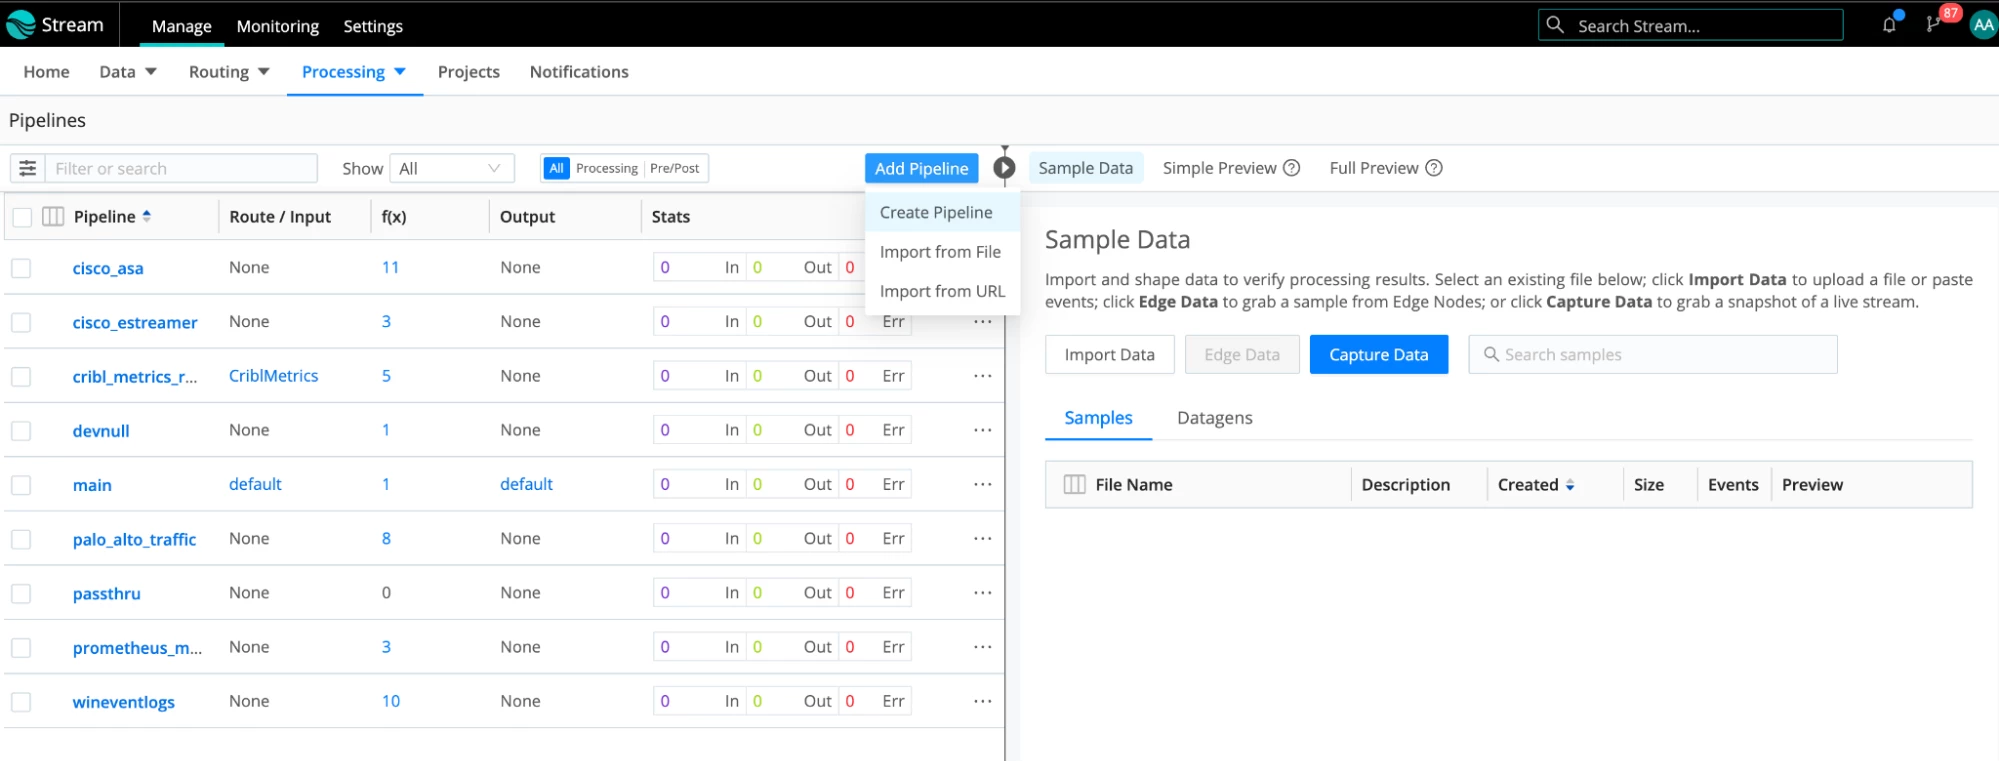
- We need to remove the source field from our events. Otherwise, Elasticsearch will reject the data because the field named “source” already exists in the mapping and will result in a mapping conflict. The payload will be sent inside the _raw field, so it should work without this field. Let’s create a simple Stream pipeline with one Eval function that removes this field. Select Processing -> Pipelines from the menu at the top.
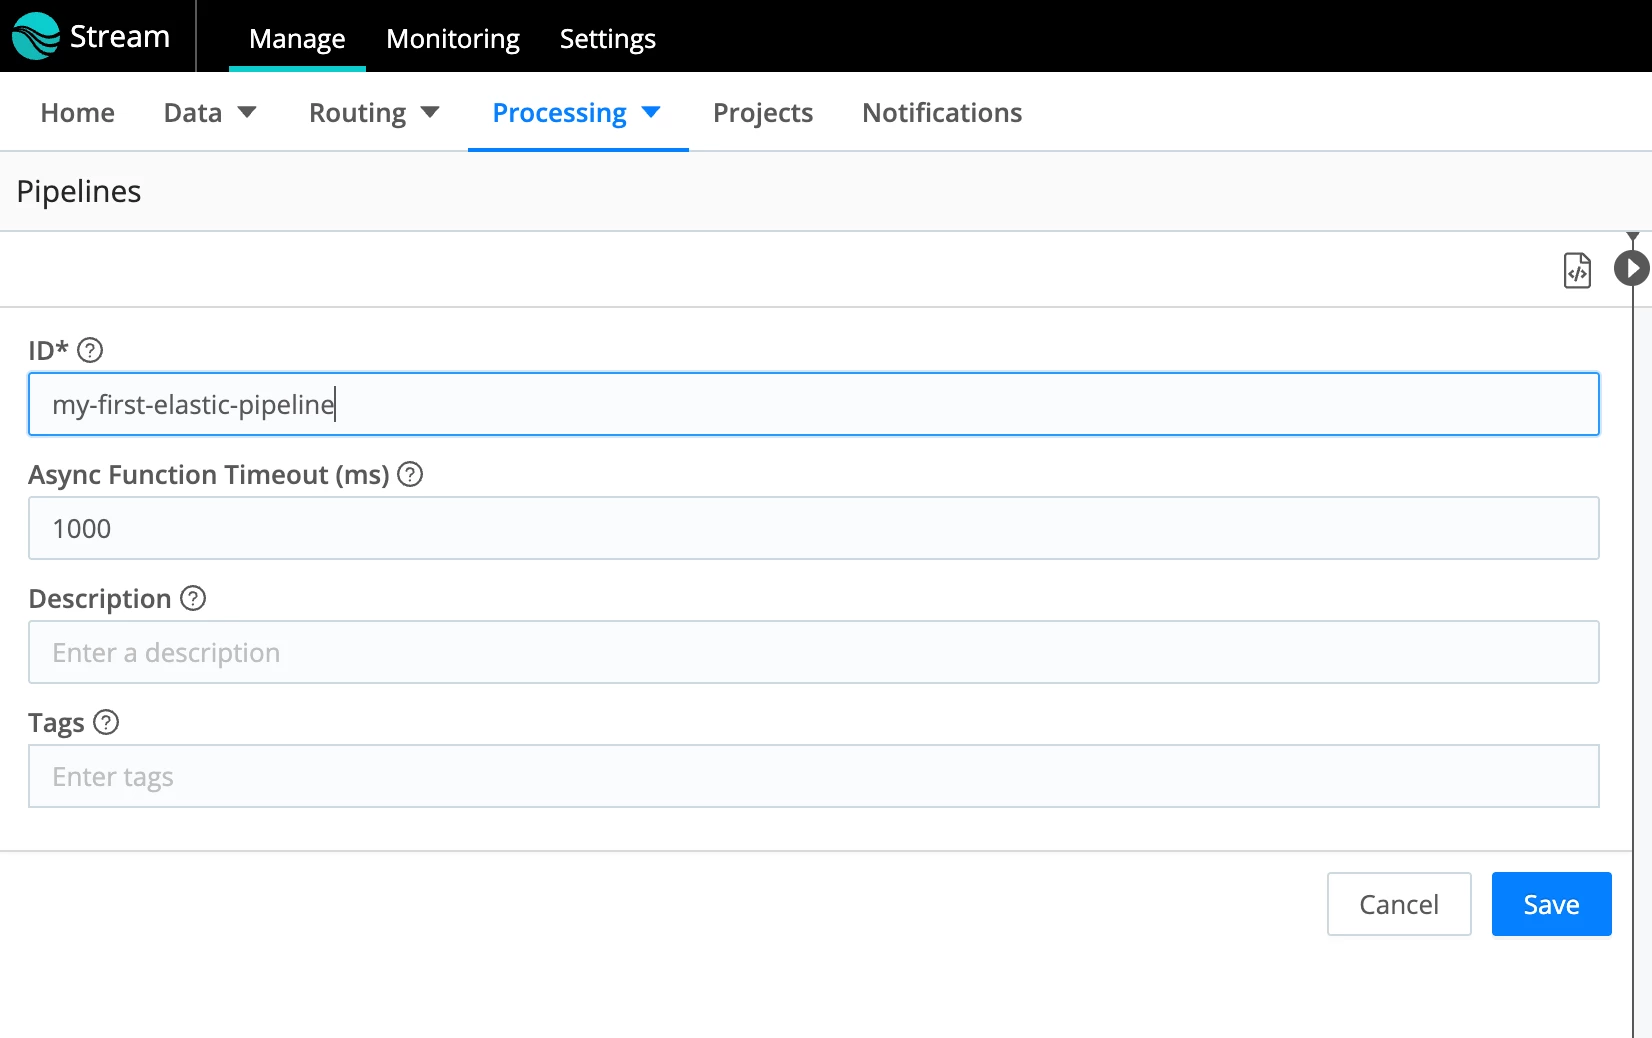
- Click Add pipeline -> Create Pipeline.
- Give it a name and click Save.
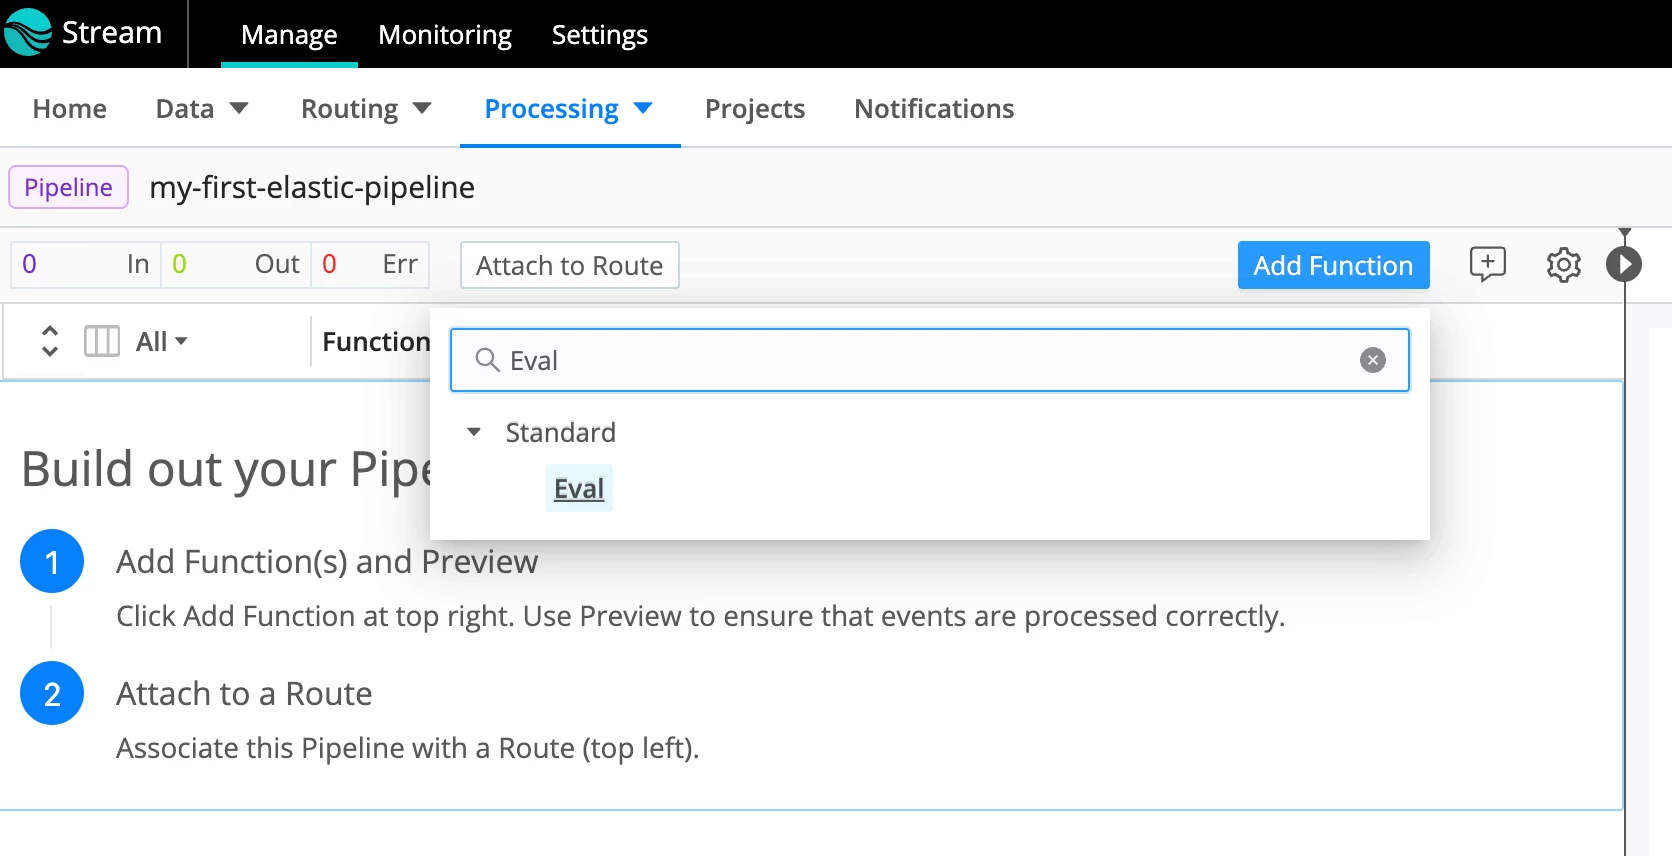
- Click Add Function and select/type Eval:
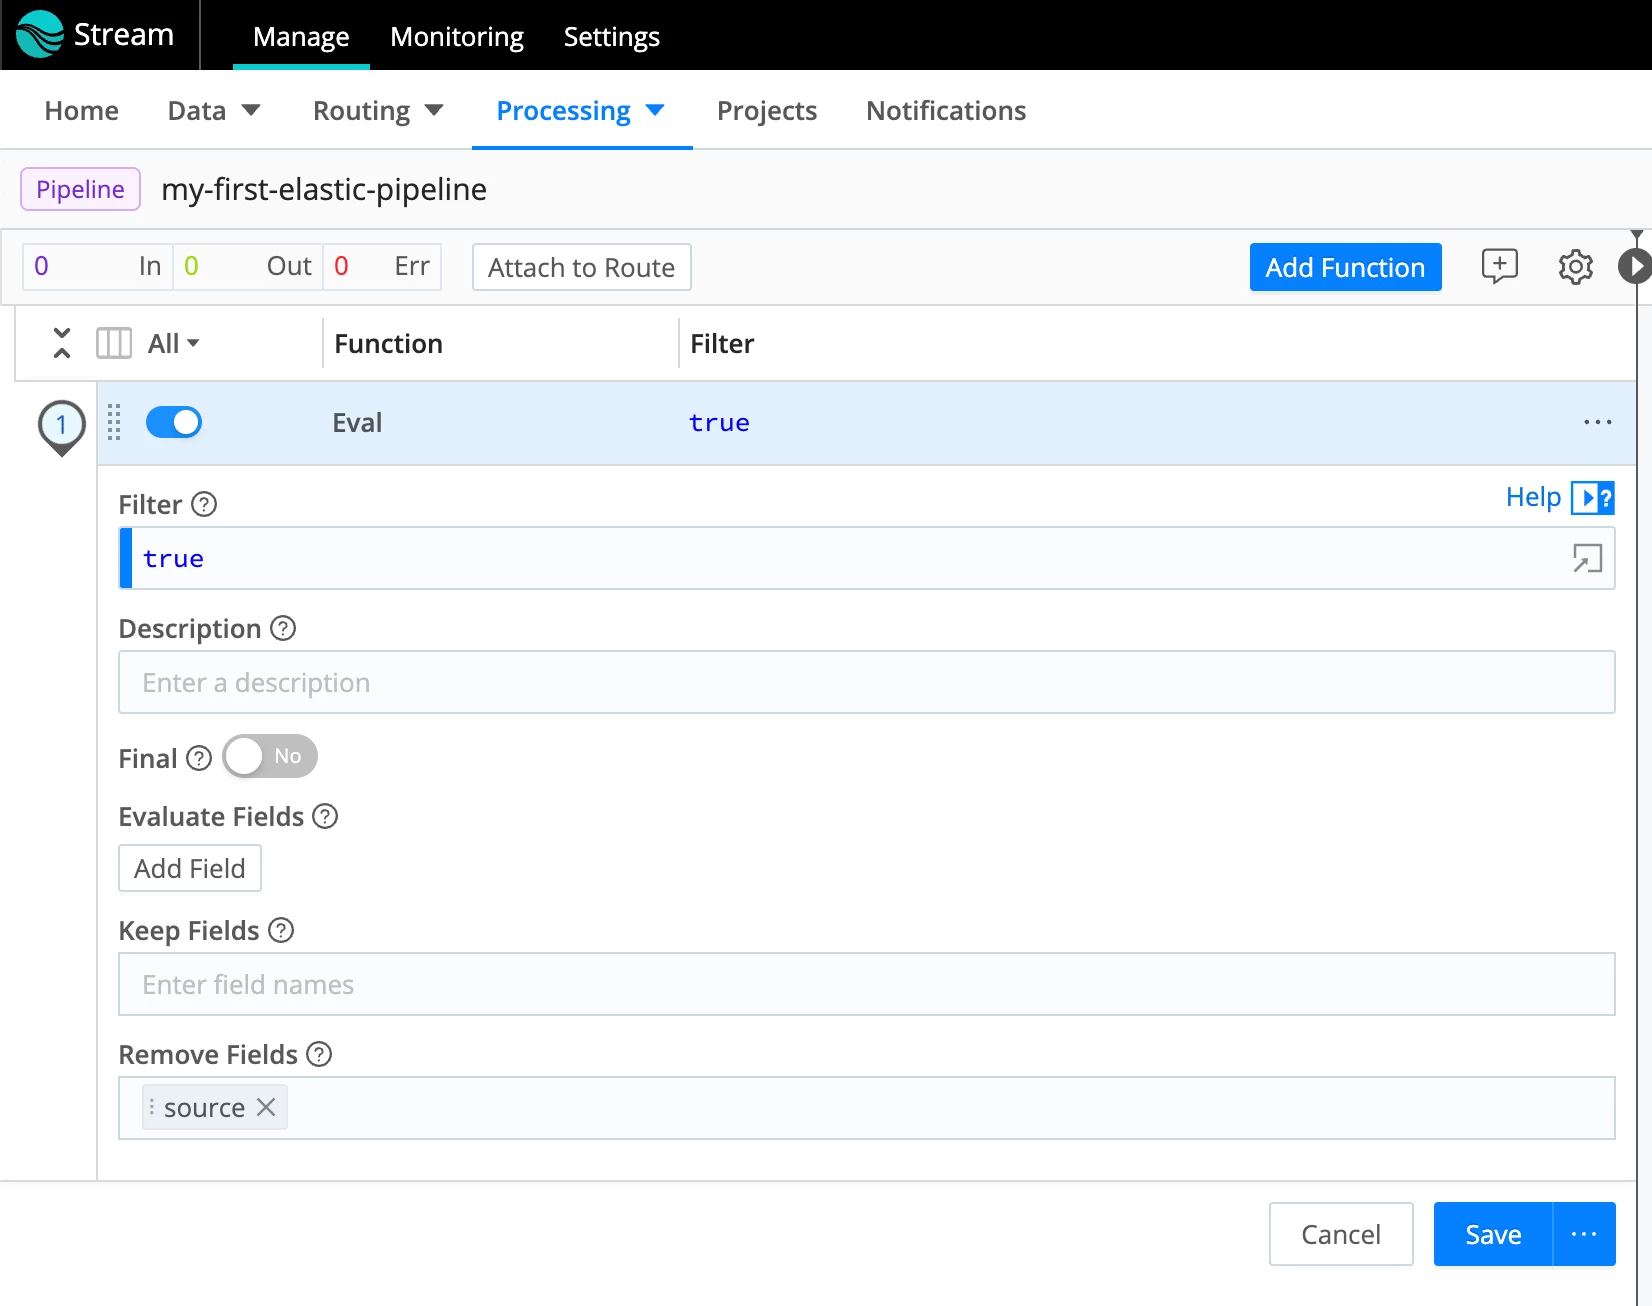
- At the bottom of the Eval Function, specify that the field source should be removed. Click Save.
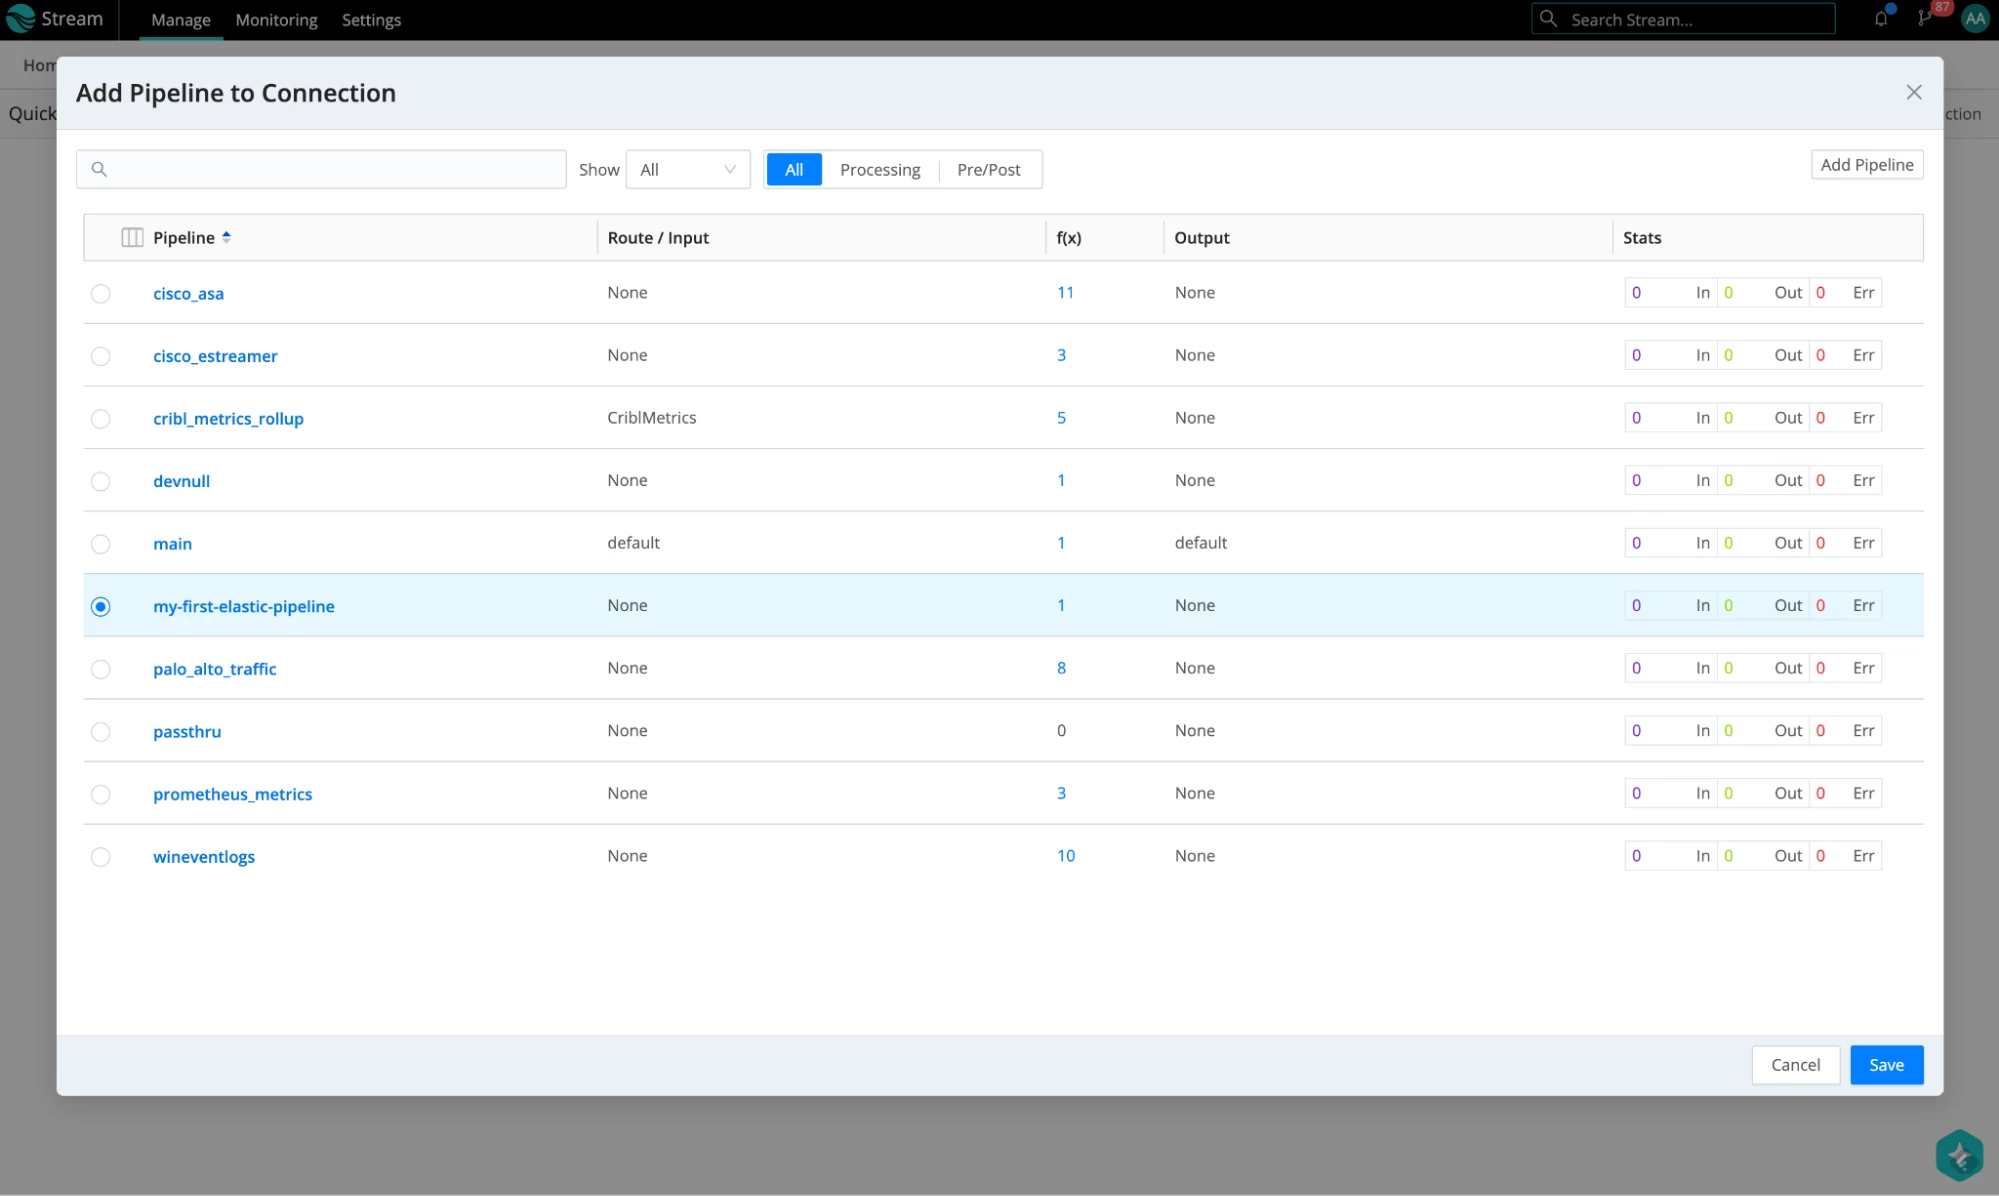
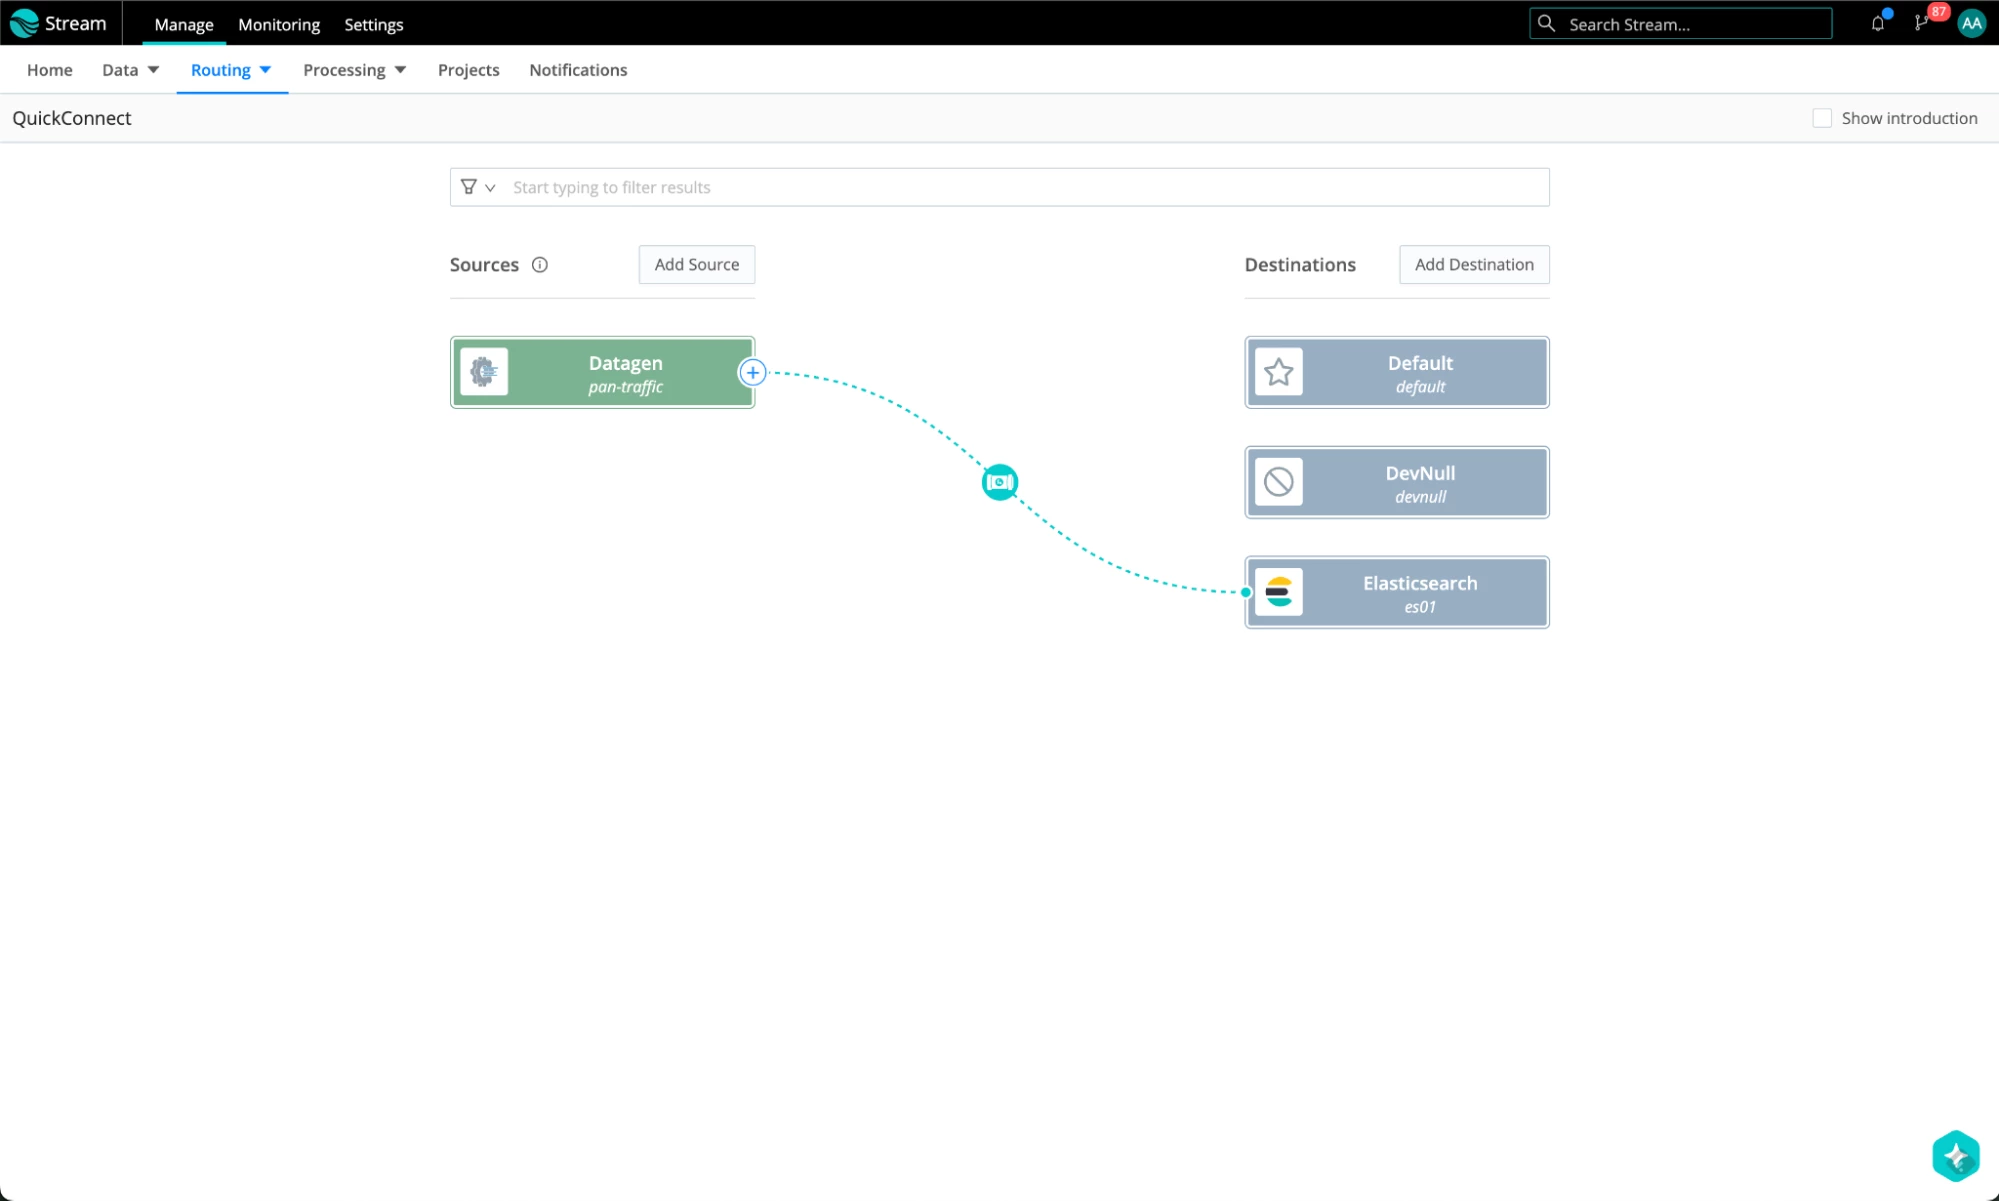
- Go back to QuickConnect (in the menu, select Routing -> QuickConnect) and add this Pipeline as a processing Pipeline for the data that flows from our Palo Alto traffic datagen source to our Elasticsearch Destination. Click on the link we added for the data to go to the devnull destination, and disconnect it from devnull. Now, drag the “+” sign to connect to the Elasticsearch destination. Select the Pipeline option and choose the pipeline that we just created. Hit Save.
- This is what the complete result is going to look like. If it’s your first Pipeline in Cribl, congratulations!
Inspect the Data in Kibana
Let’s jump into Kibana and rewind the time since our datagen sends out predefined events timestamped in the past, and watch the out-of-the-box Kibana dashboards light up with the data sent by Cribl Stream.
- In Kibana, select the Dashboards menu. Select [Logs PANW] Network flows dashboard:
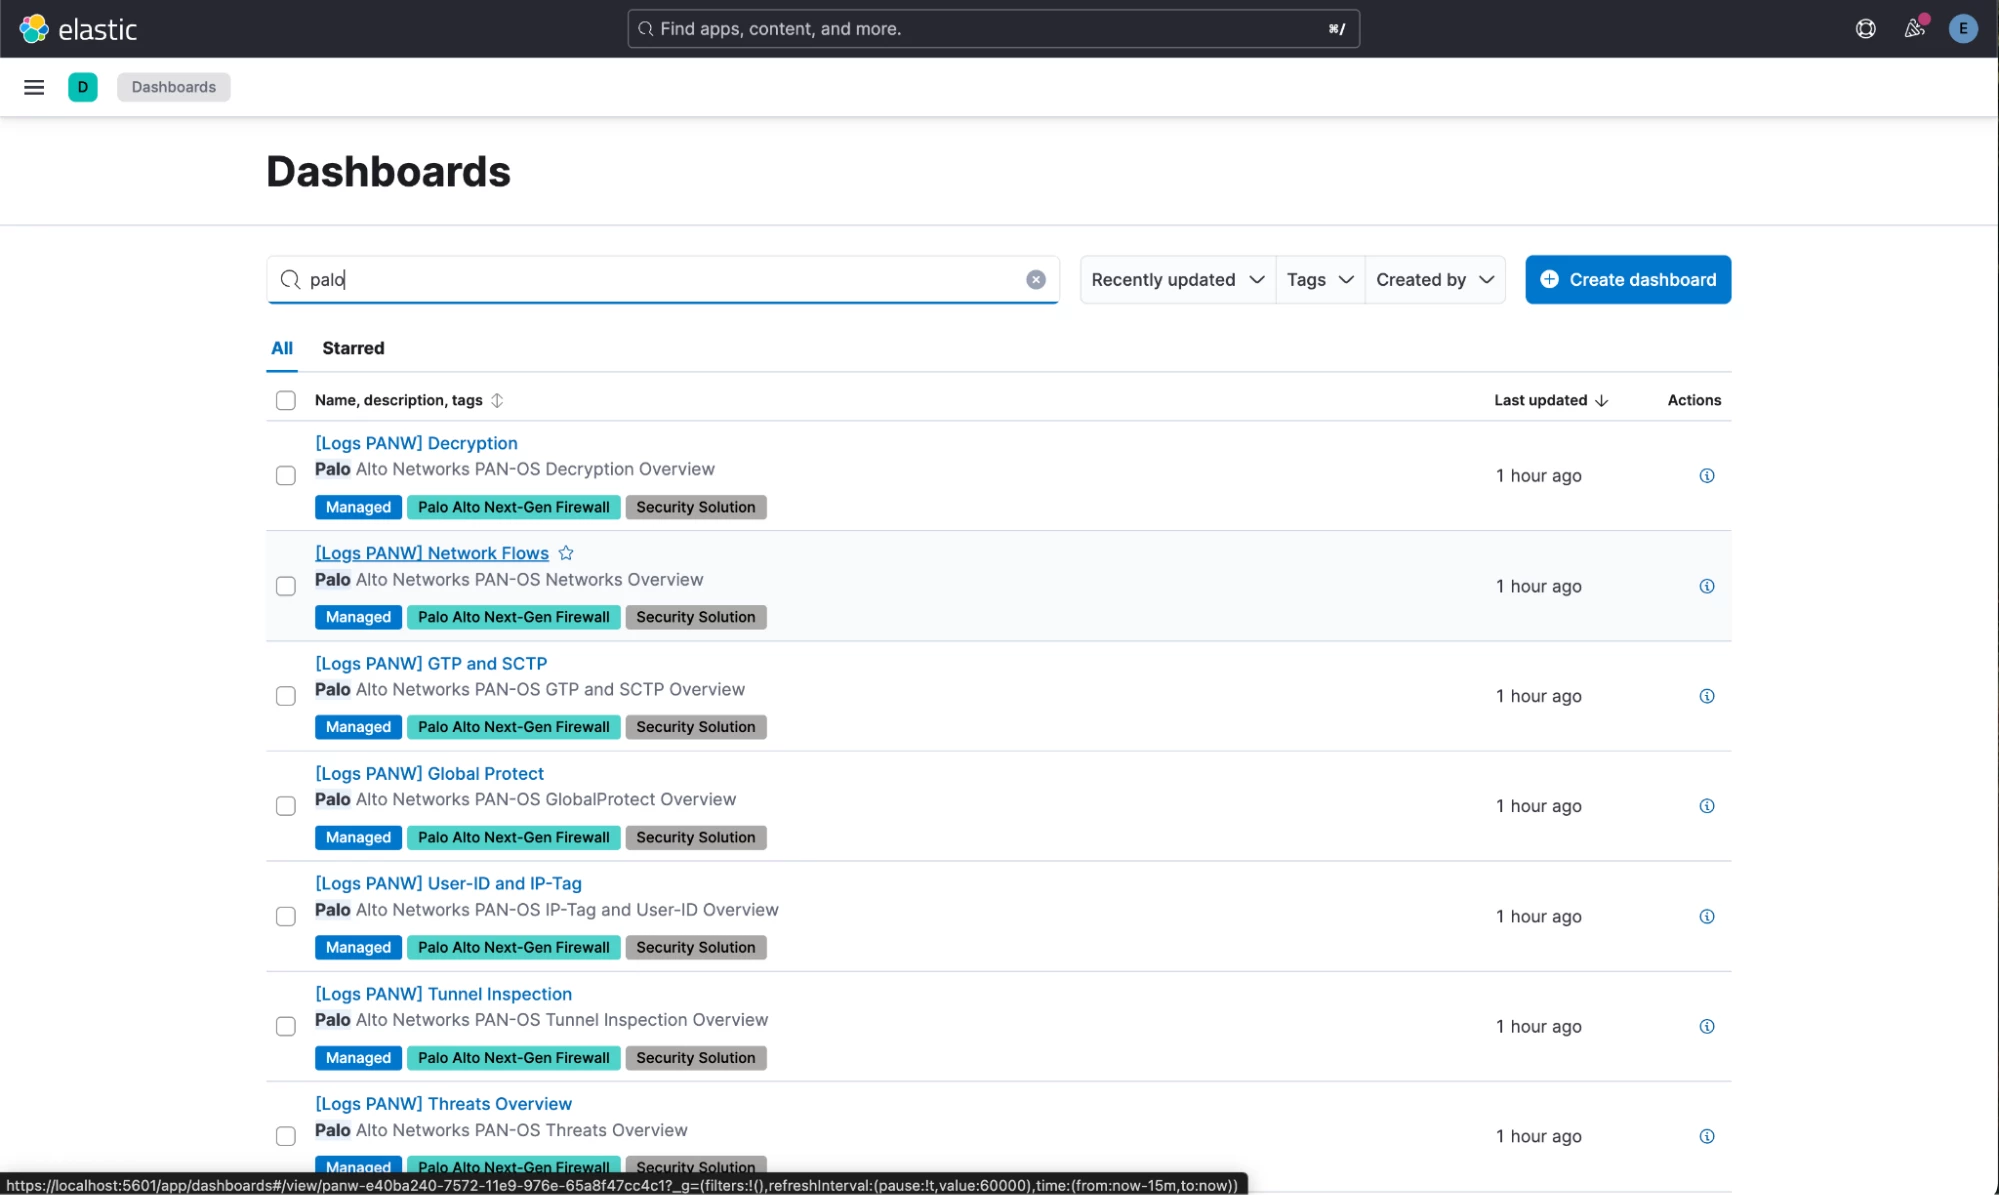
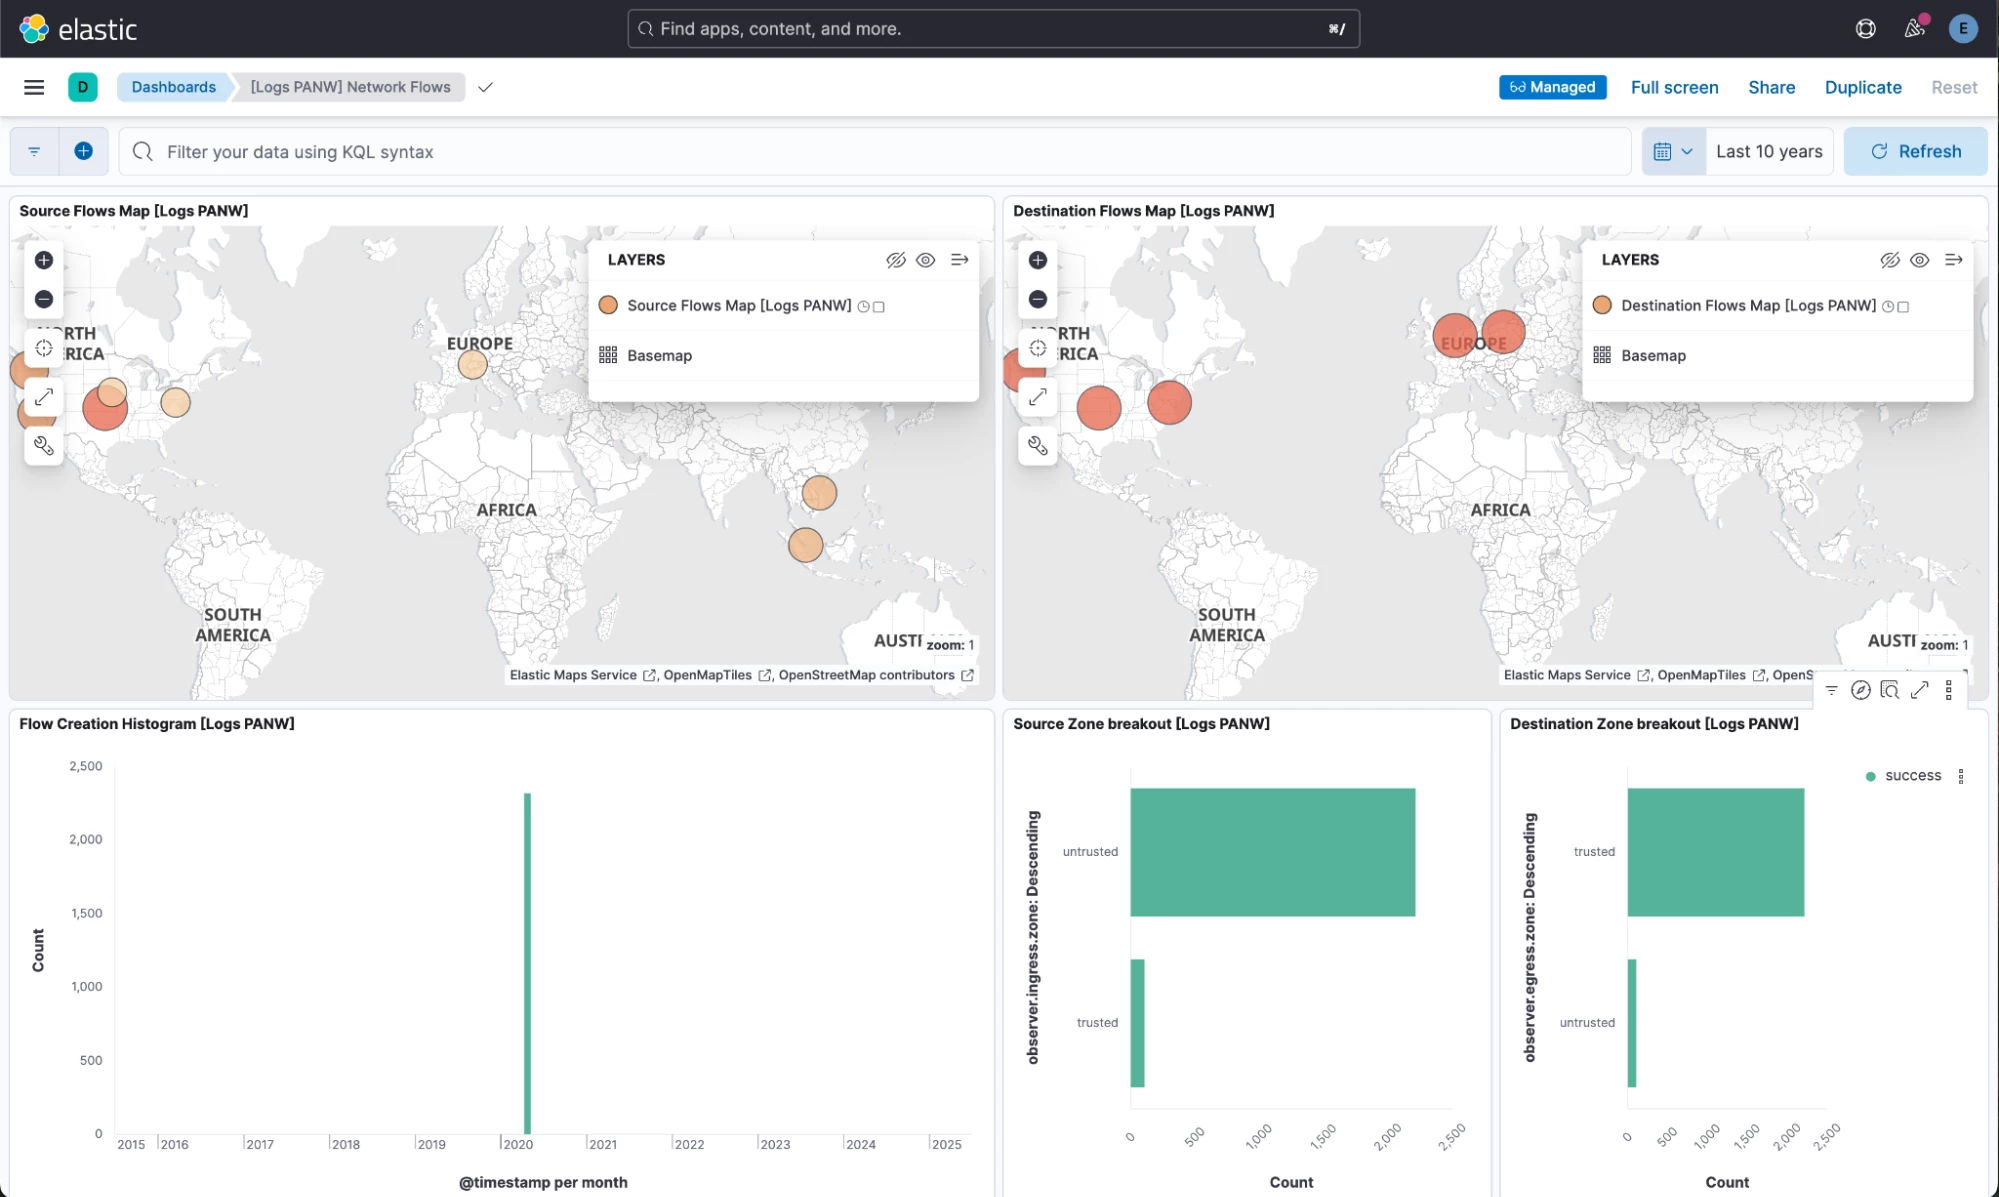
- You may need to rewind the time a few years in the time picker to see some data landing in Elastic. I selected the last 10 years to be sure. And, voila! Cribl sends PAN Traffic data to Elastic using Cribl and PAN integrations, and the data lands there as ECS, activating all the dashboards!
Conclusion
Integrating Cribl with Elastic helps avoid the complexity of installing additional data collection systems alongside the existing setup. This robust integration simplifies data management, improves operational efficiency, and unlocks deeper insights from your data. You can easily connect Elasticsearch to your current Cribl data pipelines. This means that to try out another tool, such as the Elastic Stack, there's no need to reconfigure your existing data ingestion architecture or make disruptive changes. Cribl functions as a versatile data routing and processing layer, enabling you to effortlessly direct your transformed and enriched data to Elasticsearch for indexing and analysis.