

This article will add to, and update, concepts covered in a blog from 4 years ago which covered the why's and how's of solid, intentional, timestamp extraction.
Why accurate timestamp extraction matters
SIEMs and o11y tools are foundationally supported by the time the event occurred. Everything they do depends on knowing when the thing happened. Unfortunately, developers and operators are not always so concerned with logging, much less thinking about the time represented inside the log data.
Pop quiz, hotshot: What's the epoch timestamp represented by these "timestamps?"
- Jan 7 1:00:00
- 26/1/7 1:00:00
- 1/7/26 1:00:00
- 7-Jan-26 1:00:00
- 1:00:00
- 13:00:00
It's a cruel, trick question devs and operators drop in the logging team's lap regularly. None qualify as a timestamp in my opinion. Variously…
- There's ambiguity for the day, month and year (when they're even present)
- There's ambiguity about AM or PM or 24hr
- There's no timezone information provided
- There's no date provided
This is no bueno! These are just strings that hint at a timestamp.
PRO TIP: Get all your servers, appliances and applications in UTC. Leave it up to your presentation layer to convert to another TZ when needed. K*I*S*S.
Imagine you're a SIEM. The actual time is January 7th, 2026 at 13:00:00 UTC. You receive an event with a timestamp of "Jan 7 2:00:00". Is this in my timezone? If yes, it's either coming from 11 hours ago (2:00 AM), or it's 2:00 PM. But in that case the time is exactly 1 hour in the future. Hmm, maybe it's in UTC +0100? What year is it? When is now now?
The best we can do is make guesses, and in the world of o11y and security, that sucks. For example, in Splunk a future event won't show in searches until that time falls in the time window, which by default ends at "now." "Why is this data not in Splunk?!" Well it is, but you need to specify a latest time in the future. Or in the case of an event appearing to be old, a larger time window reaching back. And then you'll need some magic SPL to compensate for the time mistake.
Events logged in the future won't show in most searches, and events logged in the past risk falling out of the window. In both cases the events appear to be lagged, not showing up in a search when the users think they should.
Even worse, your analysis tier could be paying the price when time keeps jumping around. Example: When an index in Splunk is receiving data with jumpy timestamps it has to maintain more buckets for the data. This usually leads to more file I/O, and prematurely rolled (closed) buckets, leading to higher bucket counts... all of which severely impact Splunk's performance.
Other SIEMs, like Exabeam for example, assume everything is current time. If you send an event in the future, or way in the past, it won't be included in the analysis that in theory is protecting your org from the baddies.
In the world of o11y and secops, Time. Must. Be. Accurate. There is no wiggle room here.
Stop! Cribl Time
David's blog covered many of the ways you can repair or clarify time before it's sent to the analysis tier. In summary, the top recommended path is to extract time at the Event Breaker stage if at all possible. This is by far the most preferred method. See also, Mastering Event Breakers for best practices re: event breaking. Next would be the Auto Timestamp function in a pipeline. Finally you can use JS expressions and the C.Time.strptime() to more hands-on style extract the time in a pipeline.
All well and good. But how do you know you've got time problems?
Monitoring For Time Failures
Most search tools will let you check things like index time vs event time. A large gap usually, but not always, indicates a problem. In years past, I'd recommend a dashboard scanning all logs for events that are way in the past vs index time, or any amount in the future. Something like this in SPL:
index=whatever earliest=-3h latest=+8h
| eval timediff= _time - _indextime
| search timediff<0 OR timediff>3500
| stats count(), max(timediff), min(timediff) by sourcetype
This gets expensive fast, though – pushing already scarce resources in the analysis tier. A better way is to flag these events in-flight.
Cribl Stream can easily tag events and metrics, and optionally re-route if needed, if the time is bogus. Tags give you an easier method to spot suspect data.
Routing to a dedicated destination is even more advantageous. Bad timestamps are infecting your vital data, and skewing your detections. Keep them out! Use Cribl to send bad timestamped data only to archive, or to a dedicated index or instance of your reporting tier. You can periodically run reports to see the data that's landing there.
Post-processing
Cribl Stream Pipelines are normally attached to a route. Data comes in from a defined source, routing rules qualify and identify logs based on rules, they're handed off to a pipeline, and finally the destination.
But Stream also has the option to attach a pipeline to a destination, meaning all events landing at that destination will first pass through the pipeline on their way. Rather than having to update 30 different pipelines with a change common to a destination, we have 1 pipeline for the destination to fix-up data landing there.
(Stream has the same concept for Pre-processing Pipelines: Attached to sources, processing data before it's handed off to the routing table.)
Evaluation Time
Create a new pipeline, or if you already have a post-processor on your destination, use that. Add an Eval function. First, create a new (temporary) field called now. Assign the current time to it. Now compare now to _time. Assign a value to time_suspect based on _time being either in the future, or in the past (by too much). Finally, drop now. Here it is in Stream's interface:
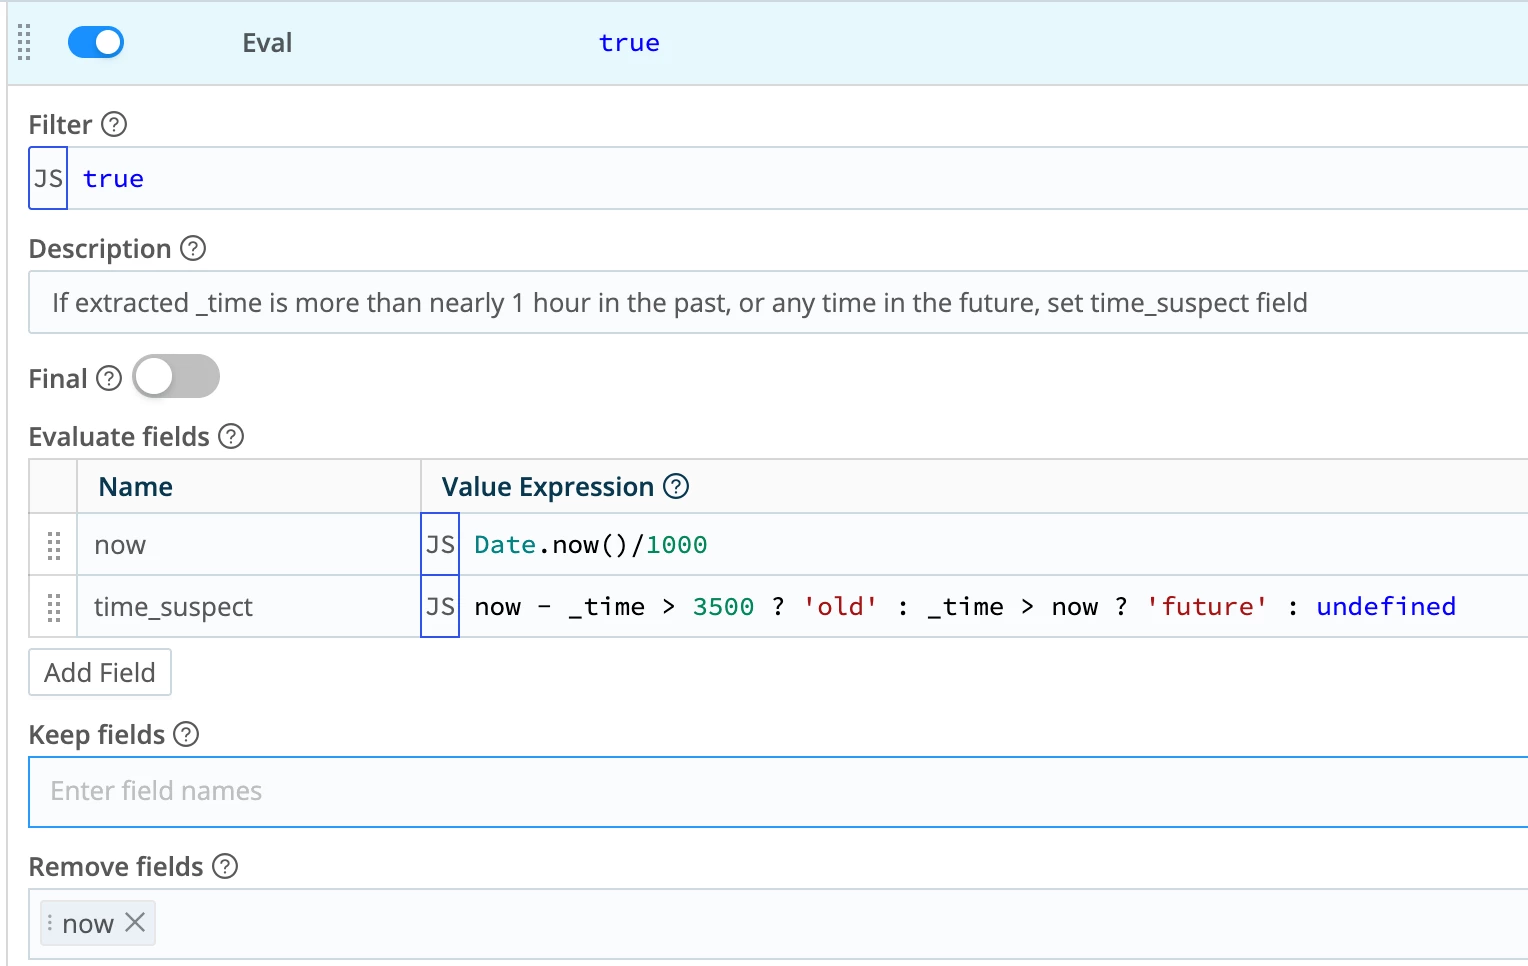
This will add a top level field called time_suspect to the event as it heads out to the destination. In some cases you may want to add it to JSON payload inside the event, or maybe in _raw. The choice is yours.
If it isn't already, assign this pipeline to the destination(s) you want to monitor for bad time.
Optionally you could include this function, or one like it, in a normal pipeline and then use the added data as routing criteria in an Output Router. If time is suspect, only send to archive, not the SIEM, for example.
Conclusion
You can’t prevent every developer from sprinkling half-baked “timestamps” across your estate, but you can refuse to let those strings wreak havoc on your SIEM and o11y stack. By being deliberate about where and how you extract time (starting with solid Event Breakers, falling back to Auto Timestamp and C.Time when needed), and by tagging or rerouting sketchy events in-flight with Stream, you keep your analytics tier sane, your investigations trustworthy, and your infrastructure healthy. The goal is to build a repeatable, observable pattern for handling time everywhere so your tools, your team, and your security posture all stay in the right timeline.