
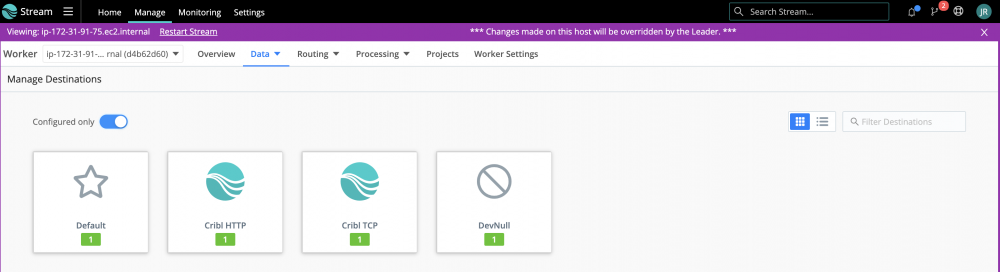
I can't get any of the data destinations to work. I have tried this with ElasticSearch, AWS S3 and Splunk. The message I get when I try a Test payload is "Error: 400-Bad Request Output … does not exist!"

The logs don't have any information either.

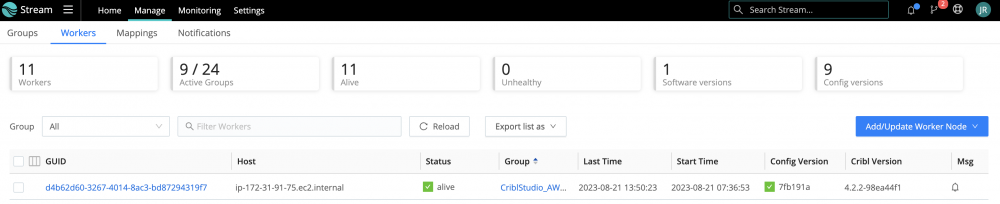
I'm running stream in a docker container. I got the same results on Cribl cloud instance as well.

What version of Cribl?


Hello Tony,

Thanks for your help. The version I have is 4.2.1-70714f62

I just tried the filesystem destination and I get the same error.


This might have been a rookie mistake. Trying to figure out what I did to get this working. Please standby


I was running cribl master and worker nodes in docker container. I configured the destinations correctly but did not commit and deploy the changes to worker nodes. For anyone else who is new to Cribl, I would recommend using a single instance configuration.


@Cribler Great callout.

The Error: "400-Bad Request Output … does not exist!" means exactly that, the output isn't configured on the worker yet.

This usually occurs because

a) The config hasn't been deployed to workers

b) The worker hasn't updated yet

c) an error preventing a configuration push (e.g. a network or firewall issue)

If you are not sure if the worker has updated yet, I'd suggest using teleportation and checking a destination live from the worker's UI.

To teleport into a worker:

  1. Ensure that the group has "UI Access" enabled from the Manage > Groups page
411_65cc101e6e87416f9d5bf4c52b57e4df.png

2. Navigate to the Manager > Workers page and then click on the worker's GUID

411_fdc6c21c481644cc81818b3f11f86b38.png

3. Navigate to the worker's desination page

411_87dd7eeab77a4735baa63db690c5a2ef.png

More information on teleportation may be found here: https://docs.cribl.io/stream/deploy-distributed/#worker-access

To troubleshoot failed configuration deployments

If you find that a worker's config version is not up-to-date, you may wish to check the worker's logs for errors that could indicate why there is an issue. You can do this from your leader by visiting

Monitoring > Logs and then selecting <your worker> > API Process

411_855bb03e84c44f039aea38ba6dcee6a2.png

Reply